
I raced my final sprint race of the season yesterday, and the only races left for this year are longer distance head races. So, it was time to use the Trend Flex chart to take an in- depth look at the various Stroke Metrics at intermediate stroke rates. I selected all my rows in the single between March and September, but restricted the analysis to stroke rates between 24spm and 30spm. The Trend Flex chart allows to plot power (how hard you are working, how much you put in) vs average boat speed (the result). Assuming that weather conditions cancel out, you can group the data by a third metric and use that to see if it has a correlation, and if there is perhaps an optimim value.


Nothing surprising. No need to minimize wash. Keep Work per Stroke close to 600J. Row long.
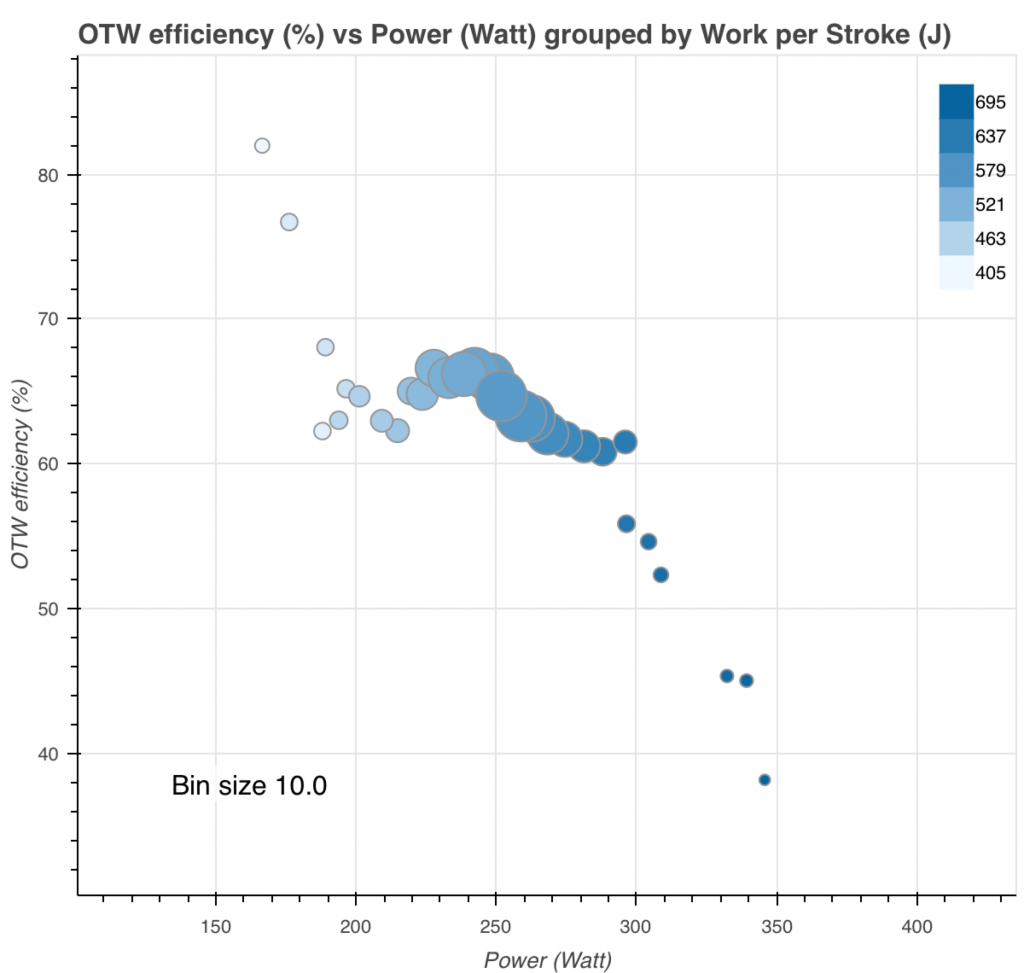
I have also experimented with a “OTW efficiency” metric, which takes into account the law of diminishing returns. As boat speed increases, it becomes harder and harder to add additional boat speed because the drag increases. The OTW efficiency tries to estimate how good you are at overcoming estimated boat drag:

Efficiency seems to peak at 250W and 600J, which corresponds to 25spm. That seems a bit low. Luckily the plateau is pretty wide.
To be continued …