
Towards the end of May, we began an adventure when we started organizing online challenges for On The Water rowers. These challenges are called GPS Speed Orders and after a trial event in Boston, Massachusetts in the last week of May, we invited everyone to rowing in these challenges and offered to help organize challenges in other locations. We’ve posted articles about how to participate in the challenges using your smartphone or your fitness watch to track your course. Now, in the middle of June, there are 5 challenges in 4 different venues, with some stiff competition brewing.
From a users point of view, OTW challenges on rowsandall are straightforward. Turn on a GPS device, row the challenge, upload your data, and see how you did. This article describes what’s going on behind the scenes for two reasons. First, because it’s cool. Second, because we have gotten a lot of questions from rowers about how it works.
When you record a row with a Speedcoach, Smartphone or other GPS device, a file is created. That file is a series of data entries that define where your boat was (GPS location coordinates), how fast you were going, what your stroke rate was, and potentially a bunch of other things like heart rate, force, acceleration, power and stroke angles at a specific moment in time. Most GPS devices will generate one of these records either once every second, or once per stroke.
Here’s an example of the kind of data that you get from a NK Speedcoach GPS. It also has data from the EmPower oarlock.
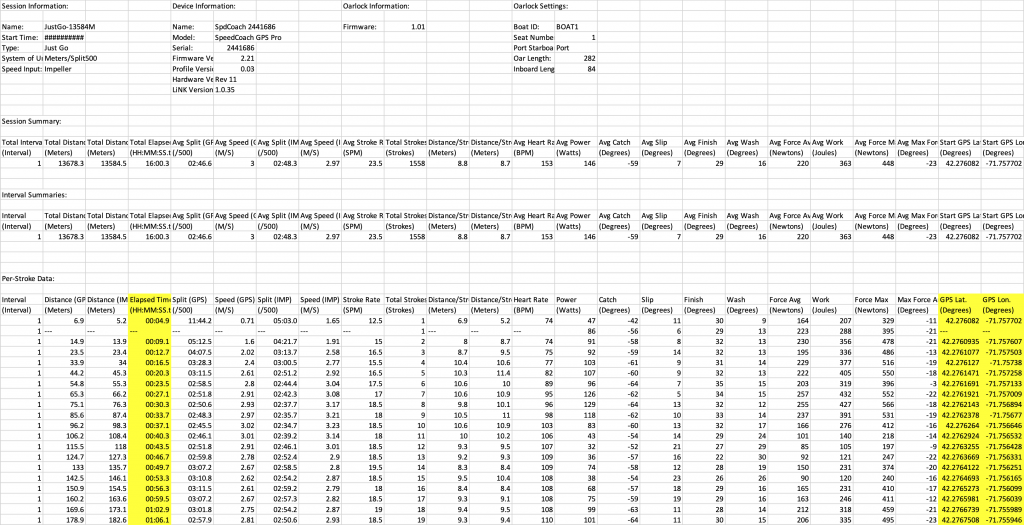
The rowsandall Challenge software works off of just three “columns” of the recorded data: Elapsed Time, Latitude and Longitude.
The first step in running an On The Water challenge is to define the exact course that you want to run. This is important for a bunch of reasons. First, since the speed differences between rowers can sometimes be very narrow, it is important to apply a consistent criteria to measure the amount of time that it takes to move through a course. Second, since there are often traffic rules on the bodies of water where we row, we want to make sure that rowers observe these rules and actually row the course as designed.
For the challenges, courses are typically designed in a tool like Google Earth, which allow you to define geographic shapes on a map and then export information about those shapes in a special format called KML (Keyhole Markup Language).
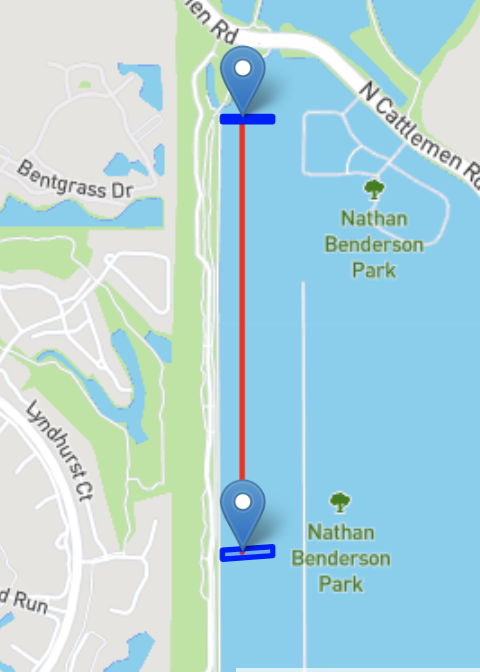
Here’s a simple course defined for a sprint challenge in Sarasota, Florida. It has a polygon that defines the starting line, and then a polygon that defines the finish line.
The “starting line” is the edge of the start polygon that is closest to the finish. The “finish line” is the edge of the finish polygon that it closest to the start.
A start and a finish is all you need for a perfectly straight course, but what about courses with turns, or course that need to obey certain traffic rules, or if you’re doing a “out and back” course where you row to a point and then row back to where you started? To manage that, the OTW challenges use the concept of a gate. Gates are a series of one or more polygons between the start and the finish that the path of a rower must pass through in the correct order for their result to be valid.
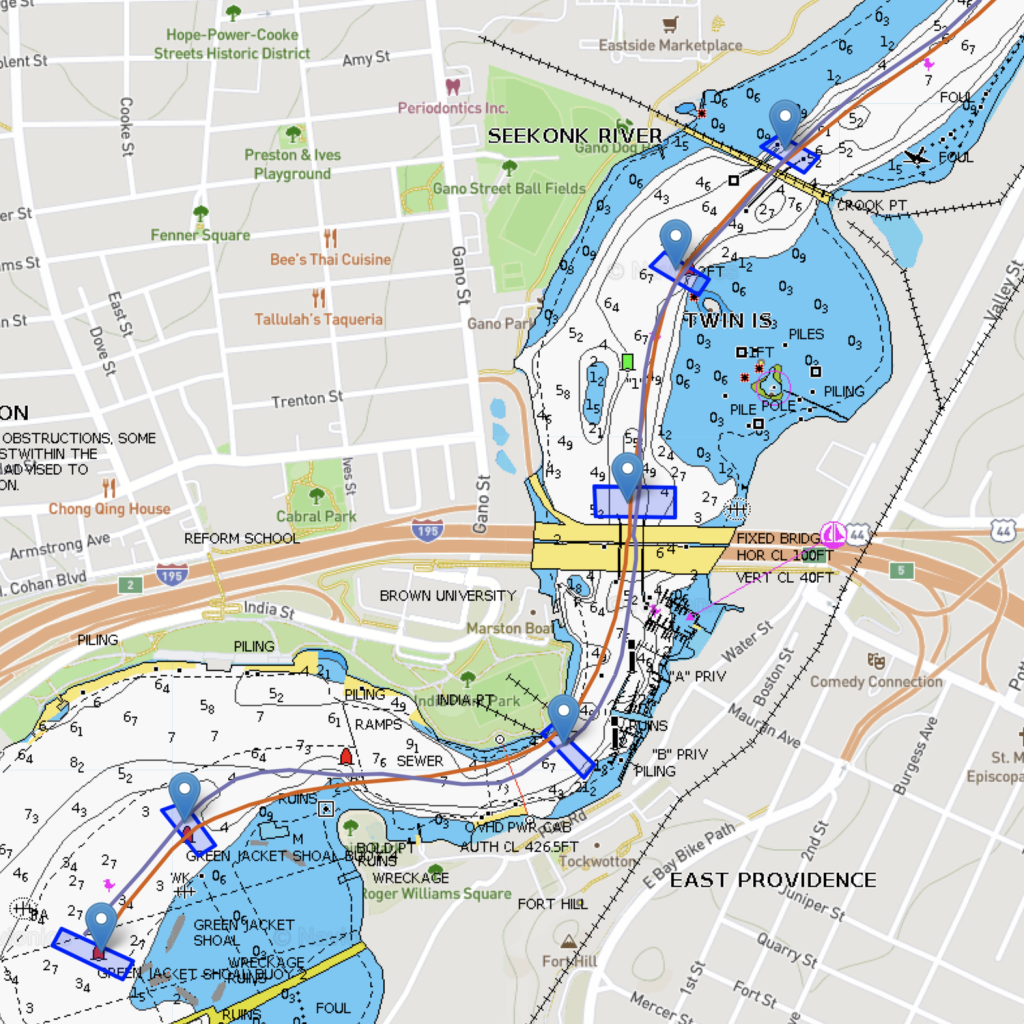
This is best illustrated by the a more complex course defined for a challenge on the Seekonk River. This course has a start, finish and 10 gates.
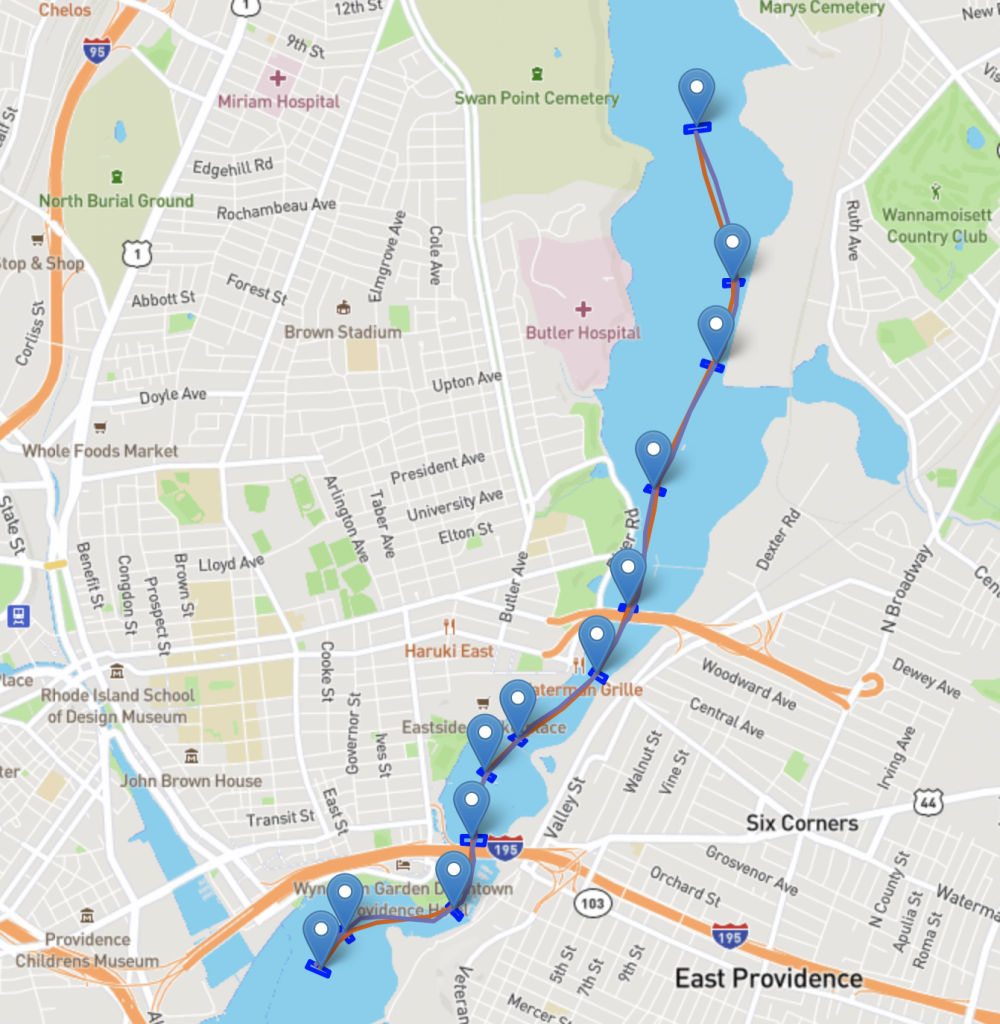
Each one of the markers shows a polygon defining the course. Here’s a closer view of the start. You can see the start polygon is defined around a buoy, as is the first gate after that. Beyond that, the gates are basically defined by the course of the channel in the river.
So the series of polygons defines the course, what does the challenge software do with the uploaded GPS from a competitor?
At a high level, what the challenge software does is estimate the exact time that a rower leaves the start box, the time when the rower enters each of the gates, and the time when the rower enters the finish box. If there is a valid time for each box, then the start time is subtracted from the finish time and that is entered as a valid score for the challenge.
While this sounds simple at a high level, there are important subtleties that allow the challenge software to work with real world GPS data.
Why can’t we just use Strava?
You might think that we could do all this using Strava segments. We think Strava segments are great (especially for running and cycling) but there are a couple of reasons why they are less than ideal for rowing.
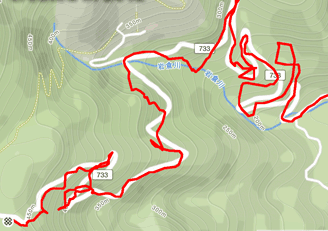 Look at the picture above. Strava’s algorithms are great at making sense of situations like this. You probably rode on that mountain road, and thus Strava will find the segment belonging to that stretch of the road. Now look at this segment:
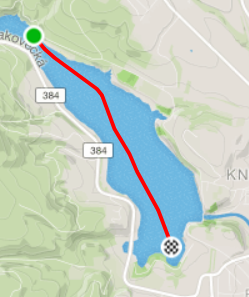
This is a 3km Strava segment that I created. It follows the traffic pattern and is rowed by many rowers daily. Still, on Strava this segment has only four participants, and although this segment is a daily staple of my training and I upload each and every workout to Strava, the last time I rowed this according to Strava was a month ago.
So it seems that Strava’s algorithms are not so great on bodies of water. I don’t know how they work exactly, but it seems they need very precise matching of course in order to register a result.
Another issue with Strava segments algorithm is that it has known problems with “out and back” segments, and these are a necessity for many rowing events.
The final issue with Strava is that you have to set your workout to “Ride” or “Run” in Strava for segments to work. I think it is weird to compete in a boat and then pretend you’re riding a bike. Also, this makes rowing an invisible sport on Strava.
How Rowsandall Tests if a rower followed the course
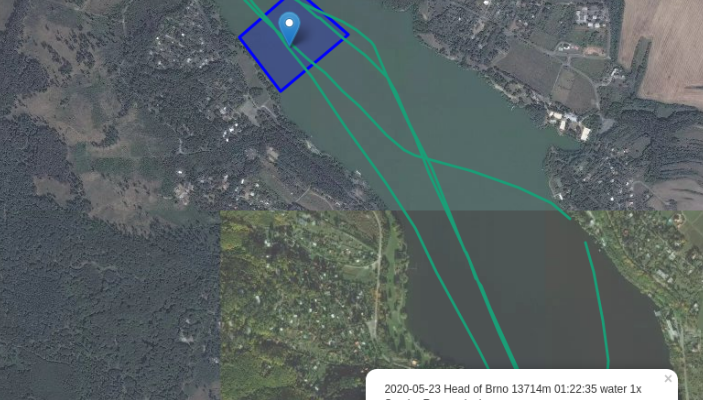
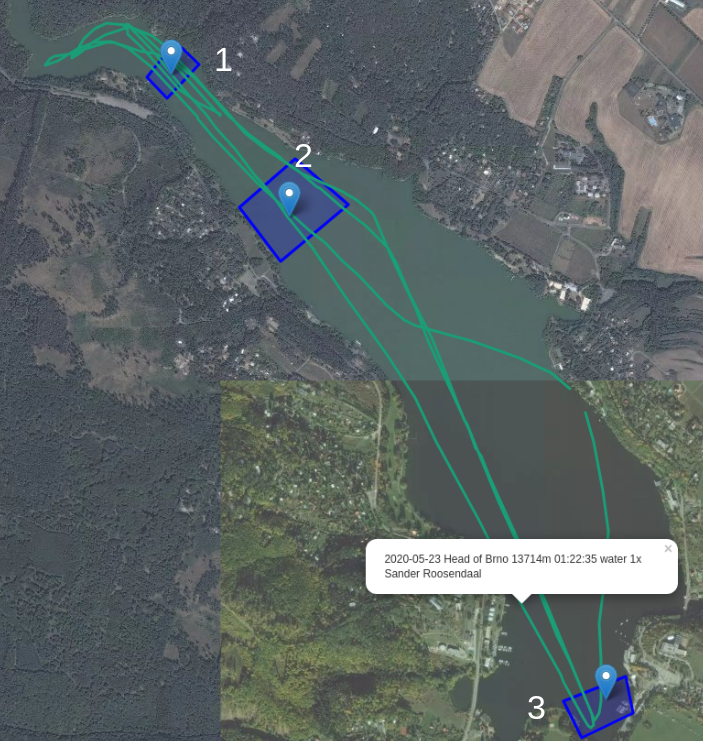 Let’s examine when you submit a workout to a virtual challenge. In this example, we’ll look at a course with a start (box #1), a middle gate (box #2), and a finish (box #3). The green lines are the complete set of GPS data for the whole row, including warmup, executing the challenge and cool down.
This illustrates one of the important subtleties in the challenge software. It needs to be able to figure out which section of your data is the right part for the desired challenge, even if you warmed up and cooled down on the course.
Here is what is happens when you submit a workout to a challenge:
- Your workout is a series of (time, longitude, latitude) triples. If you have rowed the course, some of those triples have latitude and longitude coordinates inside the polygons that define the course.
- An issue in using GPS data is that the coordinate points are usually spaced by 1 second, or sometimes by a full stroke length (2-3 seconds). Since we want to get a precise estimate of the time for when a rower cross the start or finish line, the first thing we do is resample the entire series at 100ms precision. In essence, this is interpolating a set of new triples (time,lat,long) on straight lines between your triples of your original data set.
- Once we have this fine resolution data set, we find all groups of data points that are inside the start box. For each group of points, we find the last point in time when you were still inside the start box. In the example above, there are exactly 6 such “point groups”, so we find 6 start times. If you looked at these on a map, it would look like 6 line segments that start when the rower enters the box, and stop when she exits. The algorithm finds the time when each of those lines crosses out of the box.
- For each of those 6 start times, we check if the series of coordinates for the trajectory then goes through box 2. In the example shown, we actually find that this is true for all 6 options. So, for each of those 6 trajectories from box #1, we find multiple point groups going through box 2. In our example, we have 6 potential valid courses. For other rows and courses, we may already be able to rule out some of our original 6.
- For for every path that went through box 1 and subsequently through box 2, we check if that specific trajectory passes through box 3, the finish box. If it does, we note the earliest “time in the point group” at which we enter box 3. This defines the finish time for that specific trajectory. In this example, 2 finish times were found.
- If there are more gate, this process continues for each gate in a recursive fashion.
- At this point for the example, we have 6 start times and 2 finish times which gives us 12 possible course times. We now just select the fastest of those times. If you accidentally rowed the course faster in your cool down than in your race, that will time will be chosen by the algorithm.
How to determine if a point is inside a polygon
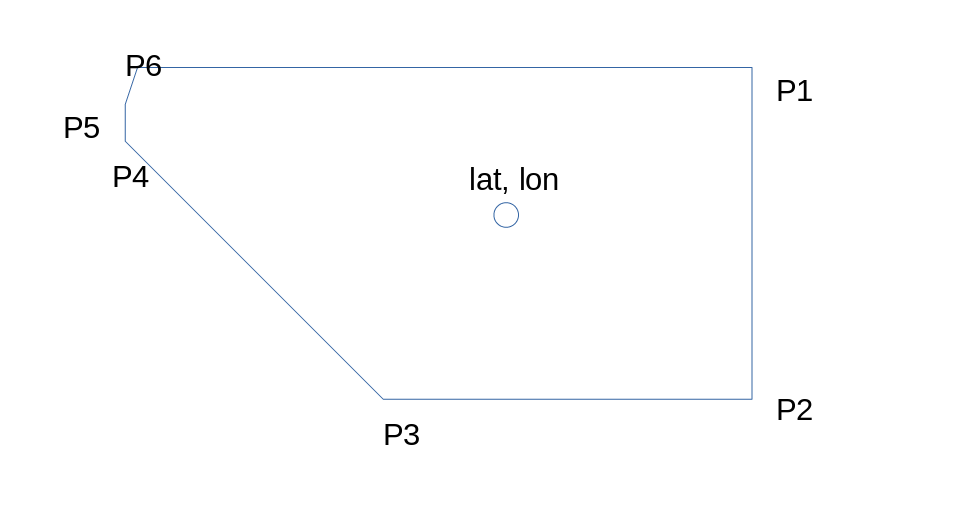
How do I find out if a point is inside or outside a polygon? Now we are entering computational geometry. Here is a comprehensive description of the problem. Luckily for us, this is a problem that occurs in many situations, for example in drawing charts. So, we found the matplotlib.path library in the python charting tool matplotlib, which has a nice “contains_points” function.
Fair distance measurements based on GPS
When we started with virtual challenges, we simply reported course length from the distance information in the raw data, and that was it. The winner was the fastest time over the course (going through all the gates). But when we started organizing challenges on the Charles River in Boston, and we had some pretty prominent scullers (HOCR winners, authors of books on head racing), they started to obsess over the course.
To serve them, we built the course comparison tool.
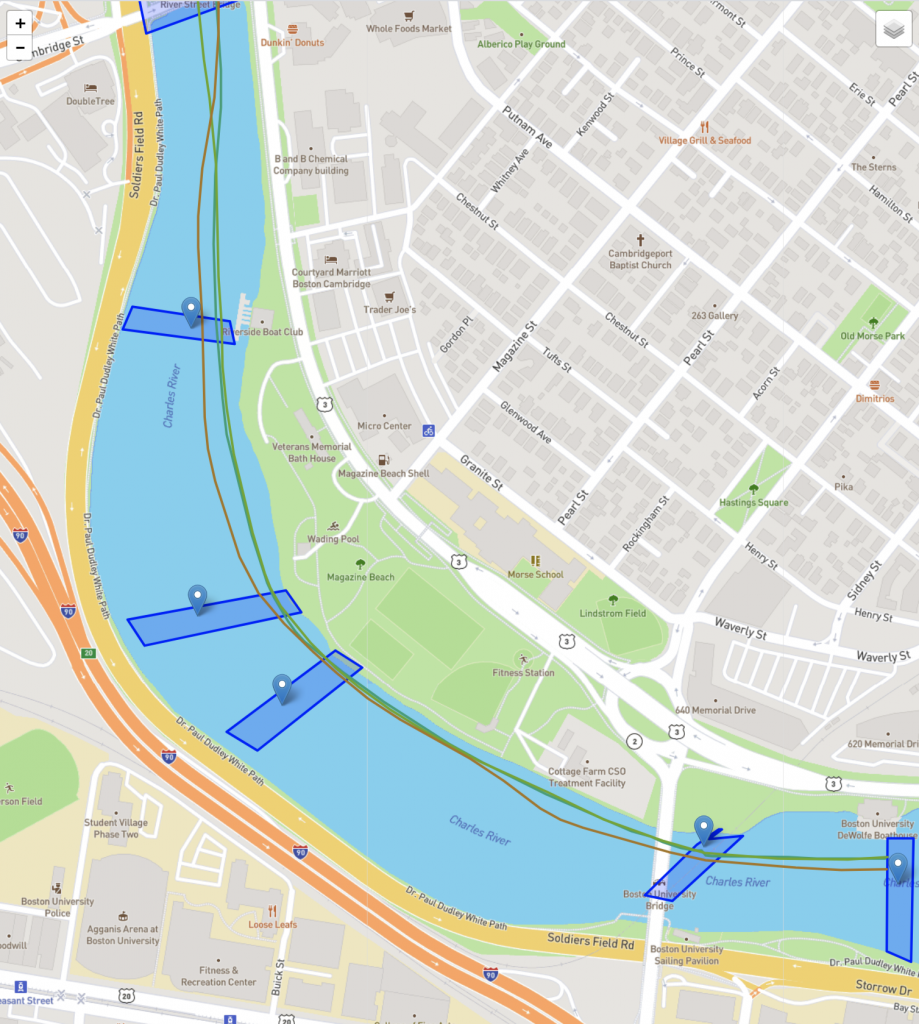
It’s simply a tool that plots the course taken by each competitor on the map.
We noticed a weird thing. Some competitors seemed to copy each other’s lines pretty well, and yet over the 4700m of the Charles River course, their course distances differed by more than 100 meters.
How did that happen? It seems so simple to measure the distance of a course.
Equation for distance between two sets of GPS coordinates
To calculate the distance between two sets of latitude 


with R the radius of the earth (6731km). This is actually the great circle distance, as the crow flies. This is a good approximation, even though the earth is not a perfect sphere.
The problem is that we get distance data from many different devices. Each device measures GPS coordinates and then uses an equation like the Haversine formula to calculate the cumulative distance. Some devices may use a different approximation, or a simple Pythagoran equation, pretending that earth is flat. We simply don’t know.
So to make a fair comparison, we had to implement our own distance calculation according to the equations above.
We are lucky that rowing happens on the earth’s surface, and we don’t have an altitude component in our coordinates data.
The influence of measurement precision
There is another “problem” with GPS data. Measurement error.
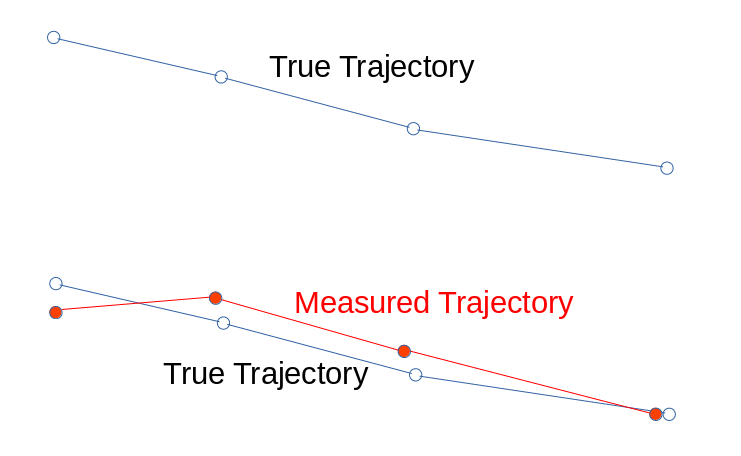
The illustration shows the issue. Your boat follows a true trajectory, but your measurement device (smartphone, smart watch, or SpeedCoach) records the GPS points with a random error. Here is a scientific article showing that the distance measured along a set of GPS data with error is always longer than the true trajectory. Also, the difference between true and measured distance depends on the accuracy of the measuring device.
It is easy to intuitively understand this. Rowing shells mostly move in a straight line, but the measurement error creates a zig zag line that moves sometimes up to a few meters to the port side of your true course, sometimes up to a few meters to the stern side. The longer the course, the larger the relative error, and the cumulative distance errors grow faster for less accurate devices.
There are satellite based systems (WAAS, EGNOS), to improve the accuracy, but for mobile phones used for navigation on a street pattern, these are usually not necessary. Some rowing apps and smart watches use EGNOS, and some don’t. We cannot know the accuracy of the data we get on the site. So, unfortunately, we cannot solve this.
If you’re really close to a competitor, and you believe you have used all shortcuts that exist on the course, the only way is to buy a really good GPS receiver with EGNOS and get more accurate data than your competitor!
A New Frontier in Rowing Competition
The Rowsandall OTW Challenges are a simple concept that has evolved rapidly into something that fills a unique role during the COVID-19 Pandemic. While these challenges certainly can’t replace the excitement of head to head racing, they add new and interesting dimensions to rowing competition. By having a challenge window that spans a longer period of time, competitors have a new variables to work with. Now we can scan the weather reports for the most favorable conditions. We can study our results, compare them to other competitors, and then try to improve our pacing. We can study the line that we took and try to refine how we steer the course. And with the Course Standard Scoring System, we can compete across ages and genders with a broader group of rowers.
Once the pandemic is under control, we can go back to the head to head racing we love. Until then, Rowsandall OTW Challenges provides a safe and exciting way to add some competitive spark to your rowing.
If you are interested in joining a challenge, you can check out the past, current and future challenges here. If you don’t see a challenge near you, contact us and we can help set one up for your club or region.