
Since a few months, Rowsandall.com has a new functionality. It’s not a Ph.D. requiring data crunching special feature, but a very simple one. But do not underestimate the History page.
When you look at your workout list on Rowsandall.com, you see this:
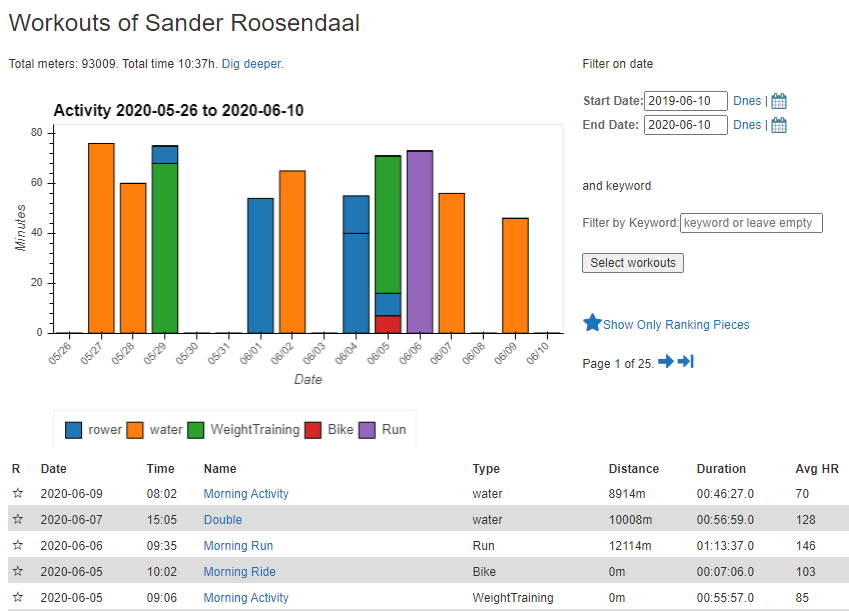
A simple bar chart of workouts you have done recently. What’s new is the line just above it, with the total meters and total time. And an invitation to dig deeper. Click on that link and you arrive at the History page:
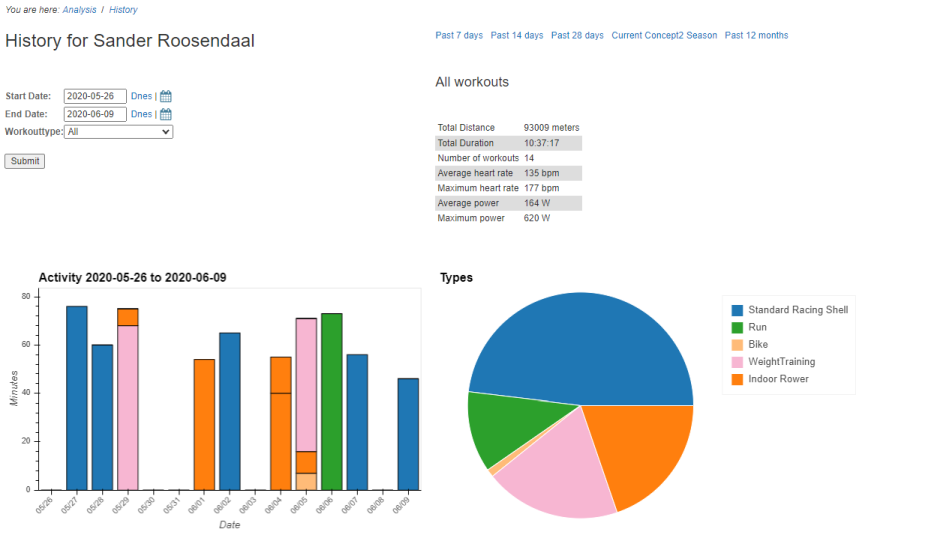 It’s a table of total distance covered, a bar chart showing when you did what type of training and a pie chart of total training time by training mode.
On the top left, you can select different date ranges and focus on one type of workout. Scroll down and you see something like this:
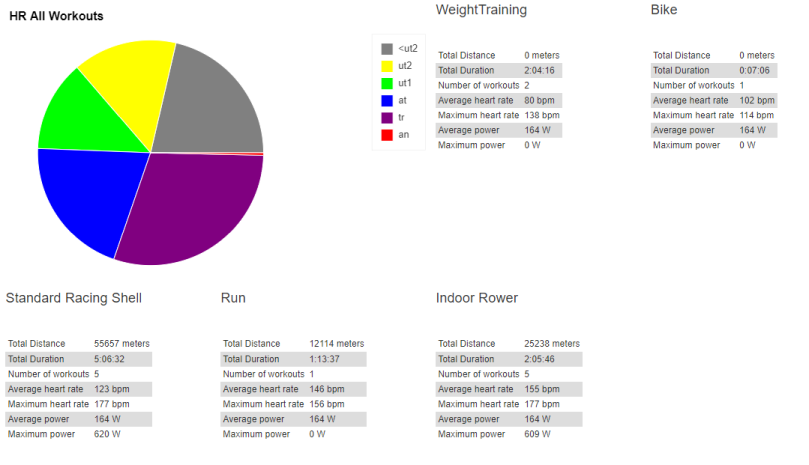
Here you see totals and averages split out by workout type, as well as a pie chart showing how much time you spent in which heart rate zone. If you train by heart rate, this is very valuable information. This heart rate pie chart can be updated to show only one type of training by using the form at the top of the page.
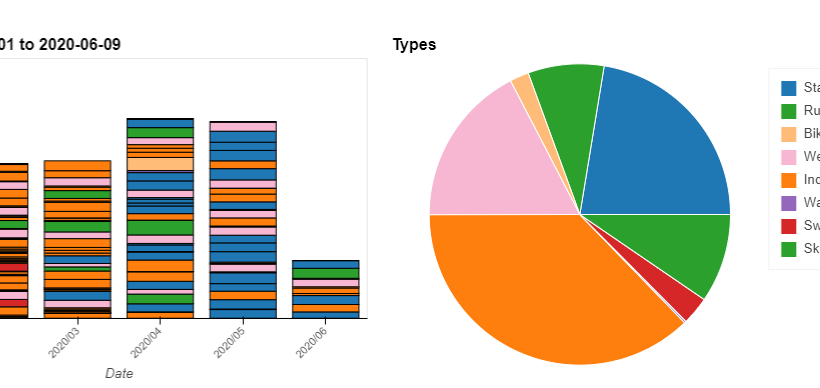
If you select a longer date range, your bar chart will show total training time per week or per month. Something like this:
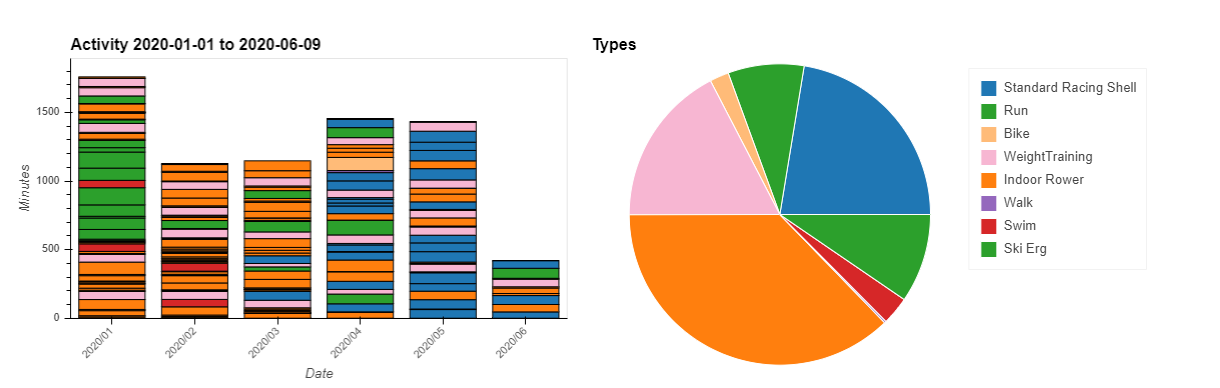
You can see how I went from erging and skiing a lot in January (and doing a lot of training because of a cross country ski training camp) to erging in February and March and you can see the on-the-water rowing (blue) coming up in May. Hovering over the different parts of the chart with your mouse pointer will give more information. Click on a particular workout and you will be taken to the workout page for that workout.
Coaches have access to the History page for all their athletes.
We are planning to expand the History page and make it even more informative. Feel free to post suggestions in the comments section below.