

Introduction
One of the most satisfying parts of training and testing on the indoor rowing machine (“ergometer” or “erg”) is to set a new Personal Best.
At the same time, preparing for the “erg test” can be very scary. Even worse, choose a target pace that is too ambitious, and you’ll experience a very painful suffering that goes on for minutes … Or even worse, you’ll hand down, step off the erg, only having to face the reality that you didn’t complete the test.
It doesn’t have to be like that. Even setting a personal best can be done in a cool and analytical way, leaving out all the unnecessary drama. You’ll still need a lot of courage to sit down and go execute your race strategy, but because the preparation was done well, you won’t have to worry about that. You can trust the plan and just focus mental energy on rowing form and holding the pace when it starts to hurt.
As an example, I will use the example of one of the athletes I am working with. Let’s call him Joe K. Joe will do a 10K test next week and has asked me to give advice on his target pace. Joe is a 35 year old man. A tall, athletic guy. I have started working with him about a month ago and I don’t have a lot of prior information. A month ago, Joe did a 2K test in 6:35.9. Also, as part of his training he has done a few sub-maximal 10K “hard rows”.
The 10K test is one of the most awful tests to do when the pacing is wrong, but all the steps described below can be easily used to determine the pacing for a 2K or 5K test.
Here’s how it works.
Step 1: Use a training log book
The key is to have training logs at hand. It’s easiest if you are using an electronic on-line logbook like the Concept2 log book or Rowsandall. You can use Strava or TrainingPeaks as well, but the sites I mentioned are geared towards rowing. In this post, I will use Rowsandall because it has lots of features that support your analysis. (Disclaimer: I am the owner and developer of the Rowsandall site.)
(When using electronic logbooks, always set your gender and birth year correctly. For sake of privacy, you may decide to not publish your birth date, but your age is a very important predictor, so it pays off to give this information.)
Step 2: Look at recent hard pieces
Joe has performed a few 10K hard pieces in the past month. None of them were all out, but he’s looking to do a full out 10K a week from now. Having those 10K efforts on the logbook, I can easily look them up and compare them.
Using Rowsandall.com, I select “Compare Workouts” from the Analysis section, select all recent 10K efforts from the workouts list and make a chart of distance vs pace. I also zoom in to the part of the row where things start to become interesting, between 6500m and 9500m.
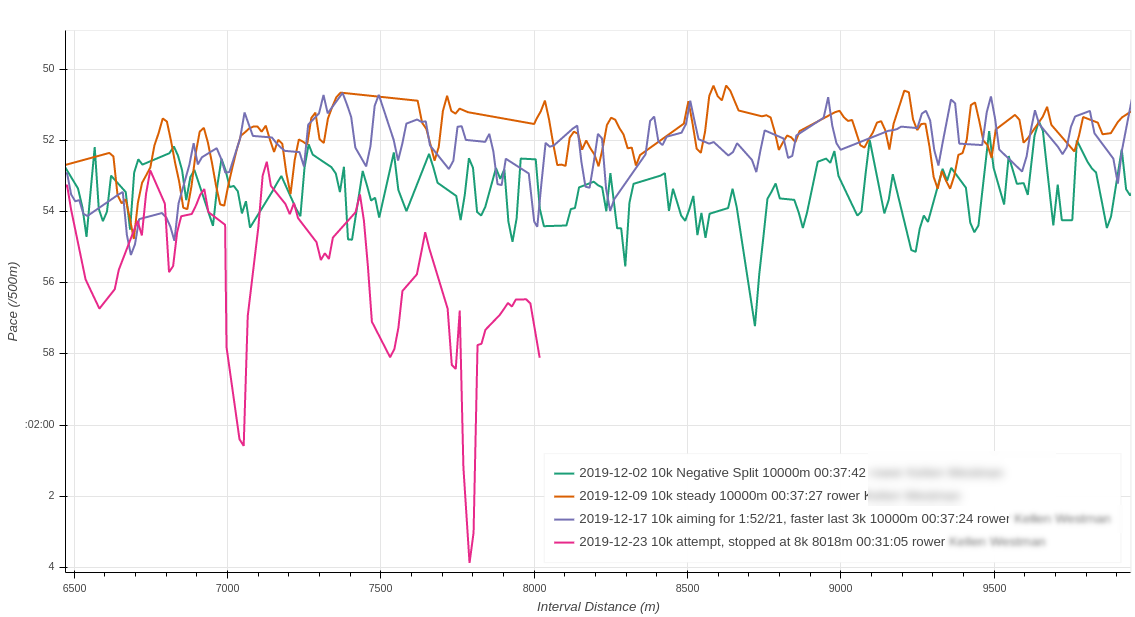
I stare at the data and read the notes in the logbook. I am noting that every time except once, Joe started to increase the pace with about 3000m to go. There was one failed attempt, and there he actually started to fall apart with 3000m to go. The log book notes his comment:
Felt increasingly awful as workout progressed. I suspect it was diet related, just not enough energy to perform the workout.
Here’s how that looks in the logbook, on the Workout Edit page:
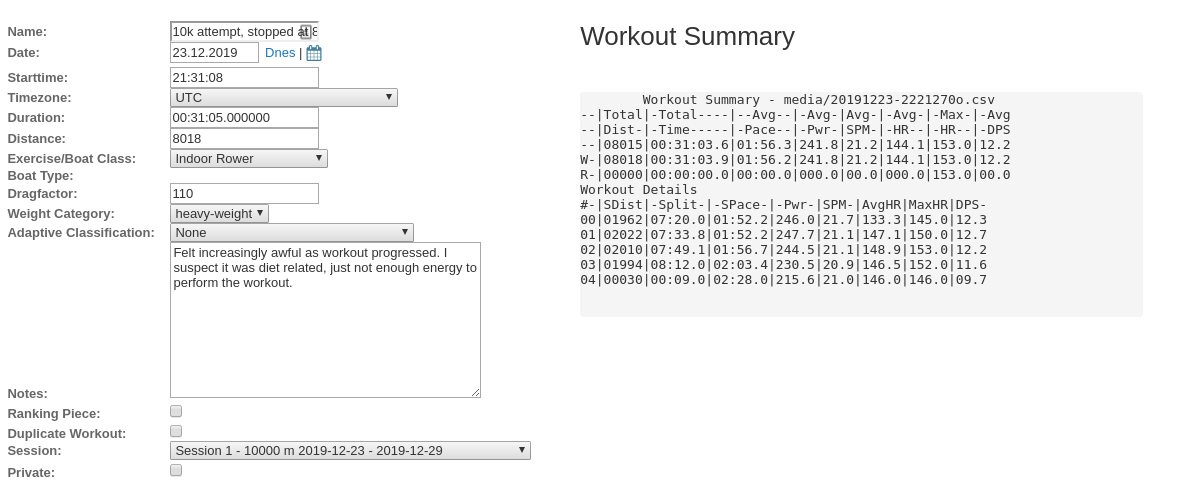
Looking at training load around this failed attempt confirms this analysis. There wasn’t anything in the training load that would point to accumulating fatigue, and also Joe hasn’t reported any illness, so it’s safe to say that this was just a one-off. So his best 10K was rowed at 1:52.1 / 500m pace, but it definitely wasn’t an all out attempt. In fact, it was done at 21 SPM. For a 10K test, you’d expect a stroke rate around 24 SPM. However, the workout notes contain this information:
Very mentally challenging session. Due to a business lunch, I had to complete this after a full workday, and after a lunch that was not ideal, and made me feel tired all afternoon. Lots of trouble keeping the pace steady at 1:52 (target) during first 7k. Felt like quitting more than once. Ultimately I decided to take the opportunity to exercise some athletic grit and push through, including a pace increase for the last 3k.
Kudos for showing athletic grit, but it also shows that going too far away from 1:52 might bring Joe into a trouble zone too early. It’s clear that if we are going to prescribe 24 SPM, Joe will have to lighten up on his stroke. How do we know how much?
Step 3: Look at Work per Stroke
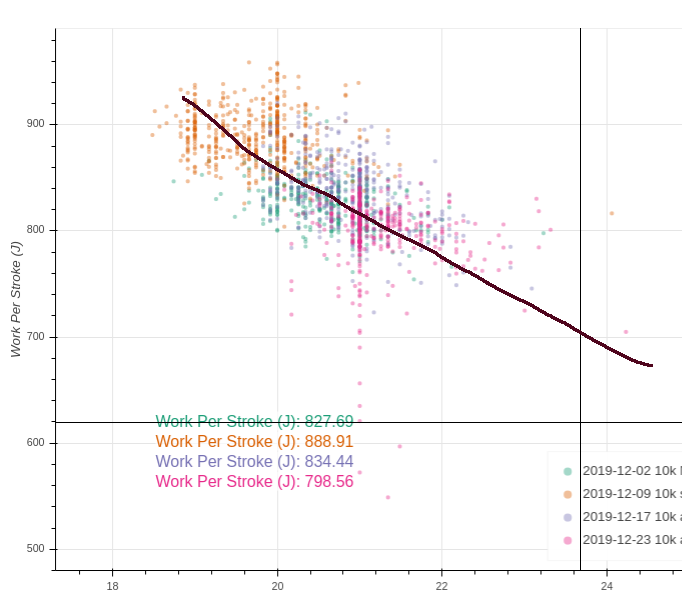
Using the data from the log book, I can make the chart above. It shows the Work per Stroke (basically power divided by stroke rate) for all the 10K attempts. I have hand drawn a black line through the data to extrapolate to 24SPM, which roughly follows how Joe tends to lighten up when he gets tired. We don’t need to be very accurate for this analysis, so the hand drawn extrapolation suffices. At 24SPM the line would be at around 700 J in terms of Work per Stroke. Multiply that by 24 strokes per minute and you get a target pace of 280W, which would be 1:47.7 pace. That is way too fast I think.
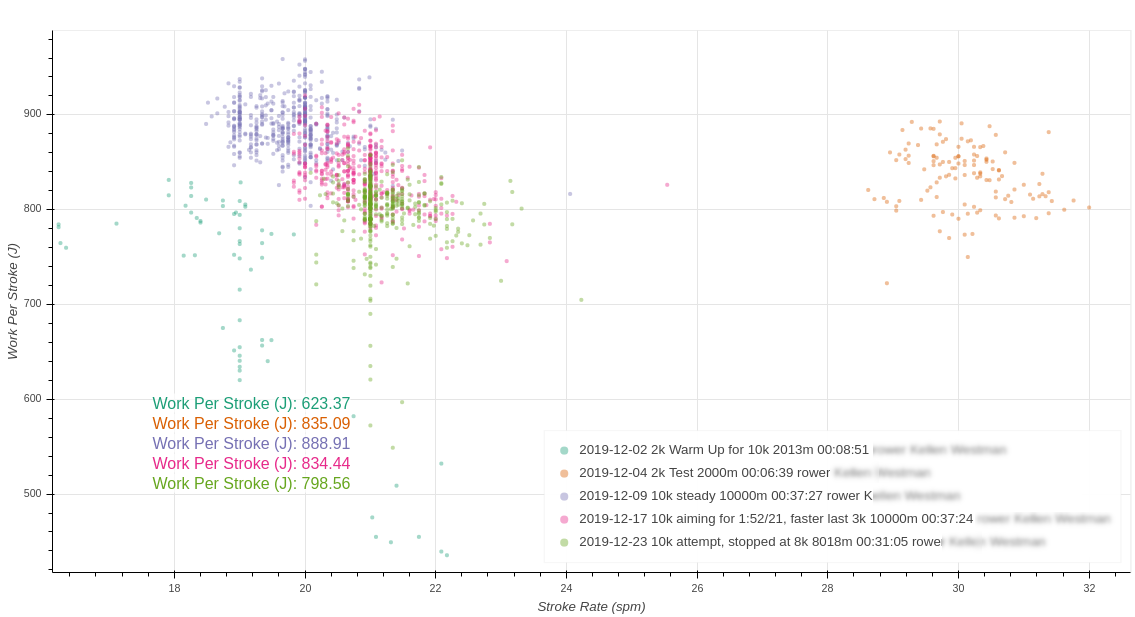
In this chart, I have plotted the Work per Stroke of K’s 2K test (at 30 SPM) alongside the 10K tests. You can see that even at 30SPM he’s pulling out strong strokes. Joe is a tall, athletic guy.
So, while extrapolating WpS from 20SPM to 24SPM suggests he pull “lightly” at 700 J, this is clearly something that K is not used to. This is a huge dilemma. On the one hand, we would like to tell him to hold 24SPM, but that leads to a pace that he cannot hold, even if he would be able to lighten up his strokes to 700J.
So we’re going to do it in the following way:
- For the upcoming test, the plan will be to start at 22SPM and rate up in the final 3K
- We’ll adjust Joe’s training plan to do more higher rate middle distance work to get ready to execute the next test, in a month or so, at the ideal rating
Step 4: Look at shorter tests
Let’s look at Joe’s 2K result.
A month ago, K tested on 2000m and rowed it in 6:35.9 (a pace of 1:39, power 350W). Let’s ignore the 10K results and presume that the 2K test is the only data point we have.
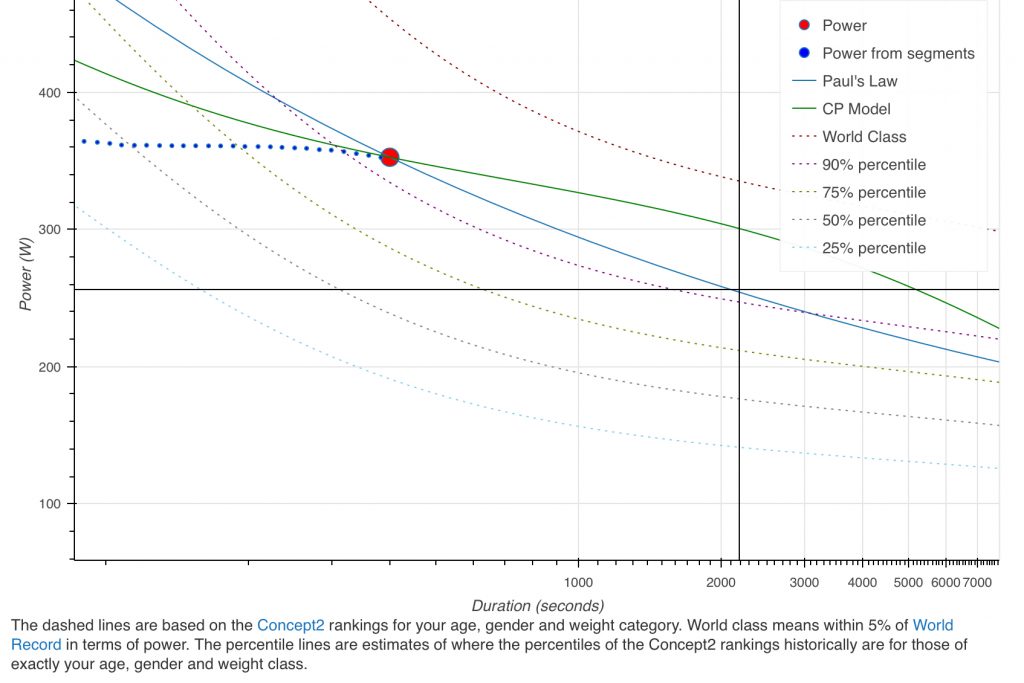
This chart is the “CP chart”. The details of this chart are explained here and here. The Critical Power Plot shows how long you can hold a certain power. The dotted lines are critical power profiles based on concept2 logbook data. Joe’s 2K power (the red dot) is right above the profile for a 90th percentile rower in his age, weight and gender class. You can follow that line out to the rough duration of a 10K test, about 37 minutes, or 2200 seconds. The 90th percentile line hits that duration at about 250W. 250W converts to a pace of 1:51.5
The blue line is the famous Paul’s low (increase split by 5 seconds for each doubling of the distance) and it predicts a 10K time of 37:07 (1:51.3 pace, 253 W).
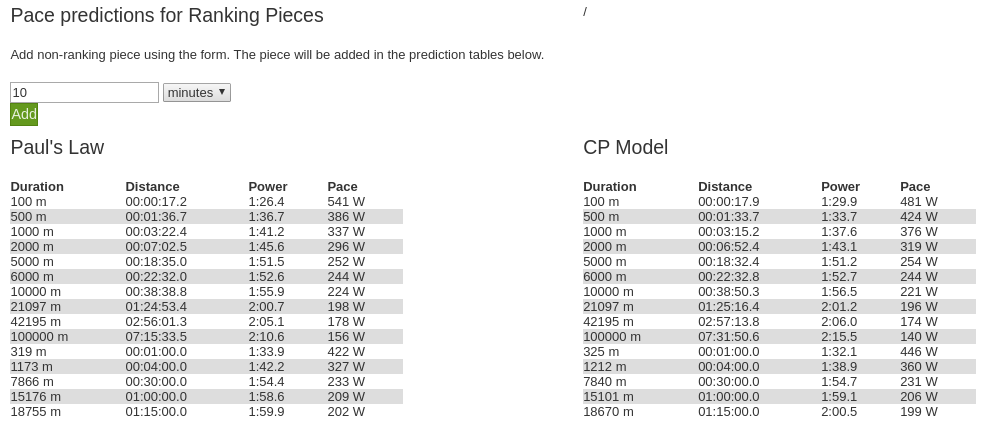
Using Rowsandall.com, you don’t have to read these values from the chart. The site has a handy list of predicted paces. As you’re adding more tests to the collection, these predictions will get more accurate:
Optional Step 5: Compare with other athletes
In the example above, we used cohort information that we gathered from the Concept2 logbook Rankings for Heavy Weight 35 year old men. It’s also interesting to look at that source directly. Joe is slightly above the 90% percentile score for his 2K.
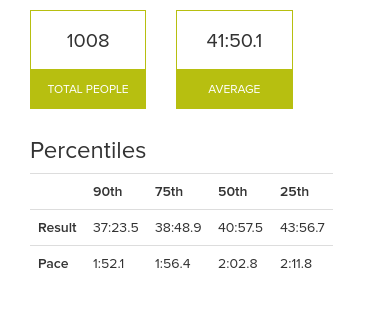
Here’s a screenshot from the Ranking pace for HW Men 10K. The 90% percentile is at 37:23.5 and we’ve already established that Joe should go faster. But remember that his best 10K was a 37:24 and he described it as a tough row. Here’s a few athletes around our target pace:
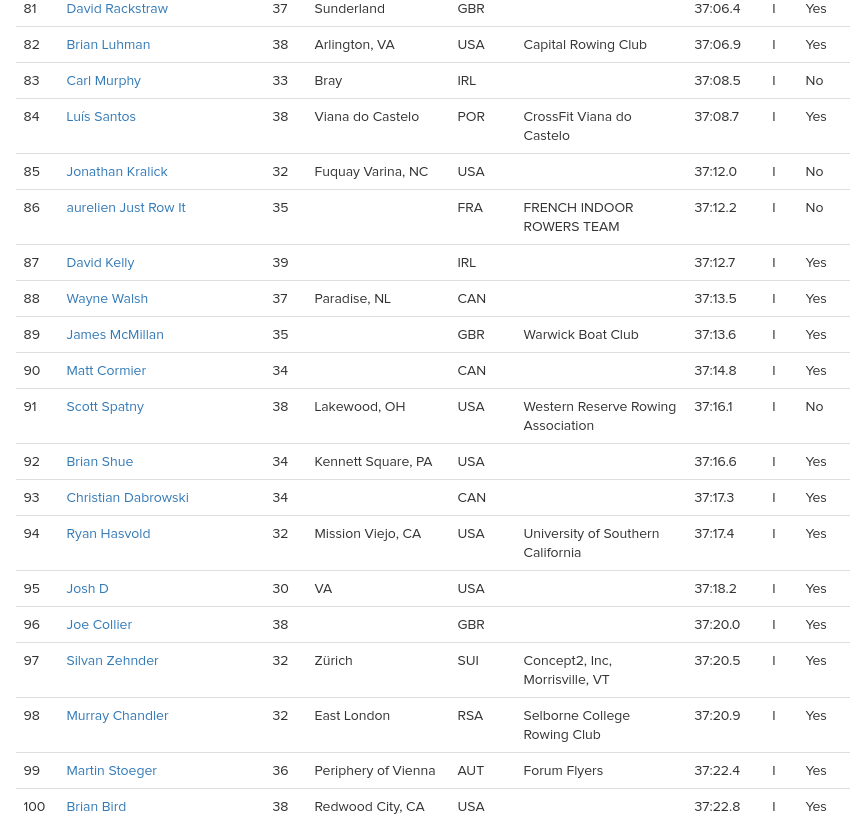
Now let’s look at 2K pieces around the 90% percentile. The 90% percentile score is around 6:40 for this group of athletes. We’re lucky. There is a Carl Murphy who features in both data sets:
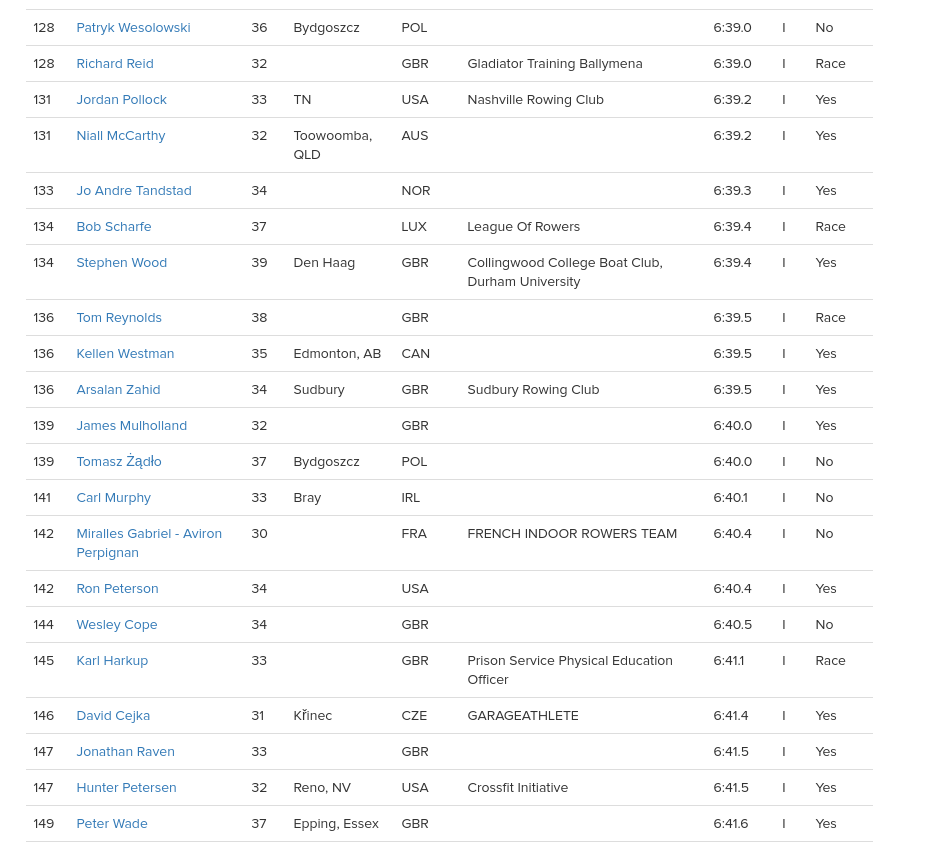
He rowed a 10K in 37:08.5 (ranking 83rd in the 2020 season) and a 2K in 6:40.1 (ranking 141th).
One word of caution. Don’t just pick one athlete who happened to hold the same 2K split, then look him up in the other rankings. It is really important to look at how the “generic” athlete behaves, by watching the cohort percentile scores. This is what Rowsandall does for you automatically, but you can also do it by hand using the 50, 75 and 95 percentile scores mentioned on the Ranking pages.
What do we do if we’re not lucky and there are no athletes that feature in both data sets? In that case, you’ll have to use the percentile scores, and the easiest way to do that is on Rowsandall.com, using the dotted lines on the CP chart.
Step 6: Put it all together
So we have established that 1:51.5 is a good target pace for Joe, but we’ve “forgotten” again that:
- On his 37:24 (1:52.2 pace) workout, he felt it was hard
- Joe has not done a 10K full out attempt yet
- On the other hand, Joe himself comments that 1:51.5 seems to be slower than what he’s capable of
That last comment is interesting, but in my experience it takes a couple of attempts to be comfortable at the edge of breaking down. I’d start conservative.
So that brings me to the following conservative race plan:
| From | To | Pace | Power | Comments |
|---|---|---|---|---|
| 10,000m | 6,000m | 1:52.5 | 245W | |
| 6,000m | 3,000m | 1:51.9 | 250W | |
| 3,000m | 1,500m | 1:51.1 | 255W | |
| 1,500m | 500m | 1:50.4 | 260W | If possible, otherwise stay at 255W |
| 500m | 0m | All Out | All Out | Empty the tank |
This plan would give an end time of 37:15.9 or faster (average pace 1:51.7).
I would give the athlete 37:15 as the target end time, with a stretch target of 37:08 if he feels very strong on test day. If he’s going for 37:08, I would tell him to not be afraid to go slightly faster than planned, but keep things in control in the early phases of the row. Also, he should not be shy to fall back to the conservative plan if he needs.
In terms of stroke rate, for Joe, I am going to keep him at his “usual” stroke rate of 21-22 SPM, at least for the first 7000m of the test. I am afraid that setting him off at 24SPM from the beginning may lure him into going too fast too early, which would lead to problems around the 7000m mark. In the future, we’ll work on getting the rate up. That will surely bring Joe under 1:50 pace.
Step 7: Execution
Preparing is one thing. Execution is another.
Remember that coaches are usually not interested in an athlete who goes out like a madman and crashes at two thirds of the test. We’re testing to see a confirmation of a fitness improvement. The best way to demonstrate that is to follow the pace plan prepared by your coach (or by you, following steps 1 to 5 above). If you’re executing it well, you have demonstrated that you are progressing. If, in the end, the plan turns out to have been too conservative, tell the coach. He will be happy to know.
Make sure you arrive at the test well rested, well hydrated and not too soon after a meal.
If there are other people around, decide whether you would like them to cheer you or not. Some athletes love getting this kind of support, others find it distracting. You need to know this in advance. Don’t let well-meaning bystanders spoil your erg test.
Put up your favorite erg music if that helps you.
Make sure you are OK with the temperature and humidity at the facility, if you can influence this. If you can’t do anything about it, let it go and don’t worry about it.
Make sure you know your pace plan. You may have it written down on a piece of paper and might want to tape it to the monitor. Make sure your handwriting is readable and the instructions are simple, like the table above.
Do a proper warming up and focus on the test.
Dial up the test distance. Get ready, take a deep breath and get going.
After the first few strokes, make sure you are locking in to your planned pace and stroke rate.
Especially in the beginning of the test, don’t let yourself be carried away by how easy it feels. This doesn’t mean anything. Stick to the plan. There is enough opportunity later to get those average splits down.
Focus on form. Every now and then, do a mental check of how you’re rowing. Strokes long enough? Posture? Any of your typical technique flaws? Just check them and correct them. The more tired you get, the more important it is to keep the rowing technical and clean.
Conclusion
Keeping your rowing workouts and tests on an online workbook gives you a lot of data to analyze and determine a target pace for your next ergometer test. I have shown you how I have prepared a race strategy for Joe.
To have some skin in the game, I am publishing this analysis (with Joe’s approval) before the actual test. I will follow up in the comments section with the outcome, once it’s done.