
One of the greatest things about the Concept2 indoor rower is the online logbook. Having a quick, easy place to keep track of your rowing training is very helpful, encourages consistency and tracks long term progress.
The best thing about the online logbook for me is the ability to rank workouts and see where I stand compared to other rowers. I think that single feature changed my life. I had always intended to be in better shape and had exercised irregularly throughout my adult life, but as soon I saw where I ranked, I wasn’t exercising anymore, I was training…Training to climb those rankings.
And with the release of the mobile application ErgData, Concept2 enhanced the online logbook to show more detail about your rows, with stroke by stroke plots and interval summaries.
So, it seems very weird to be writing about rowsandall as a better online logbook. But if you look at it, even at a summary level, it’s got a lot more to offer.
| Concept2 Online Logbook | Rowsandall Logbook | |
| Manual Entry | Yes | Yes |
| Indoor rowing app support | RowPro, ErgData, Boatcoach | RowPro, ErgData, RowCoach, BoatCoach, PainSled |
| Outdoor Rowing Apps | None | RowCoach, BoatCoach, CrewNerd, RiM, SpeedCoach, Quiske |
| Interval Detail | Yes | Yes |
| Redefinable Intervals | No | Yes |
| Host Screenshots | No | Yes |
| Summary Plots | No | Yes |
| Data Import | Supports ergdata, painsled and boatcoach | Yes |
| Data Export | Manual | Manual, Automatic |
| Official rankings | Yes | No |
| Compare Workouts | No | Yes |
| Critical Power Analysis | No | Yes |
| Power Trend | No | Yes |
| Stroke metrics | No | Yes |
Here’s how I use rowsandall as a logbook.
- I use the Painsled rowing app on my iphone. It connects to the monitor on the concept2 rowing machine. Painsled is available for iOS but not for Andriod. The good things about painsled are:
- It works in background (so if I want to watch a video and collect data at the same time, it all works great)
- It collects all the stroke metrics (ergdata shows them, but does not export them)
- Interval rests are accurately shown in the data (ergdata messes them up)
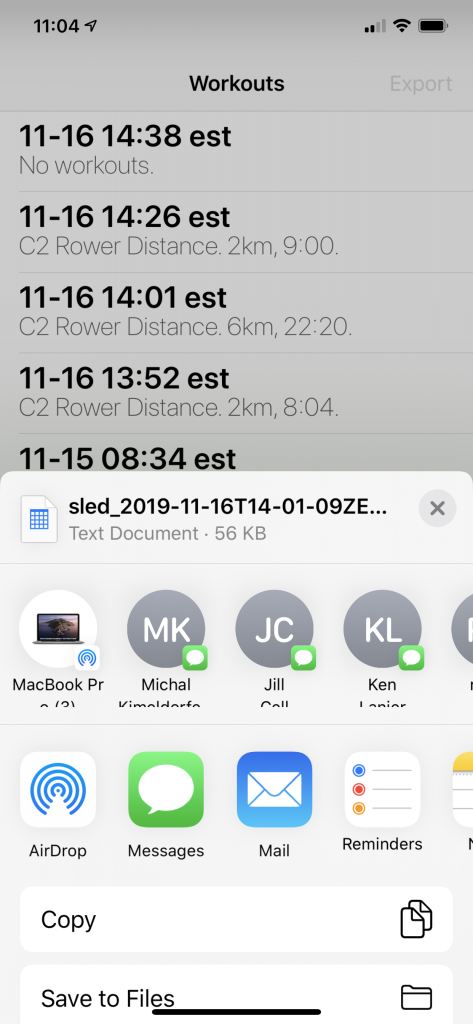
- After my workout, I use a feature in Painsled to export data by email.
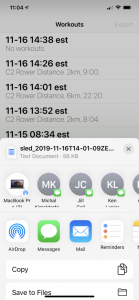
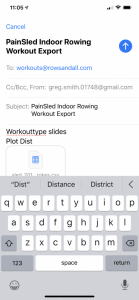
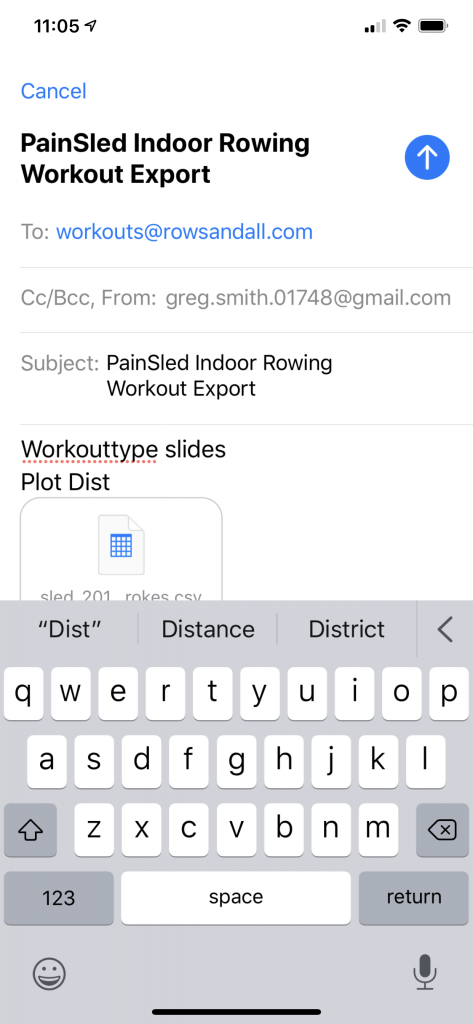
When you send to the magic address “workouts@rowsandall.com”, the online tools look at the senders address and automatically adds that workout to the user that matches up with the address. In the email, I add the description “Workouttype slides”, which the tools use to set the workout type, and “Plot Dist”, which automatically generates a summary plot for me to look at.
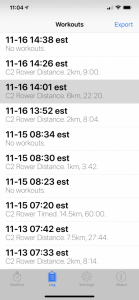
- In a minute or so, I get an email that my workout has been added
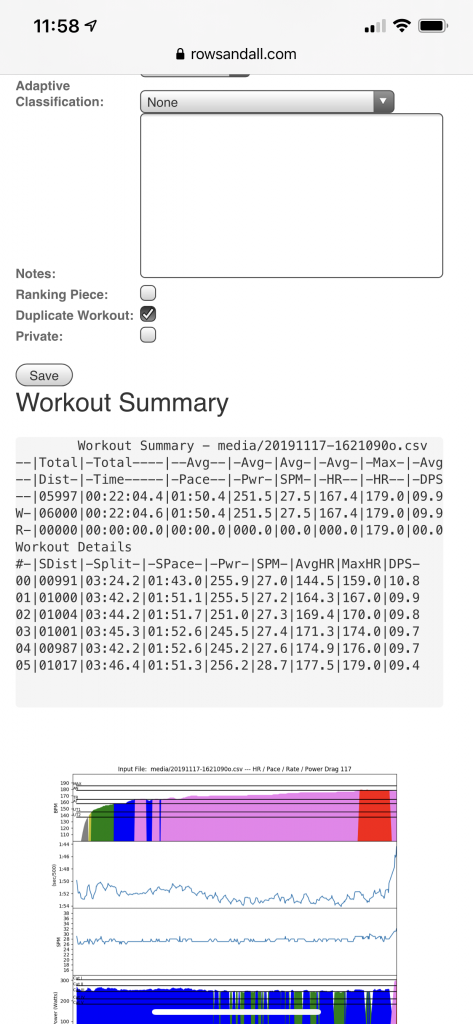
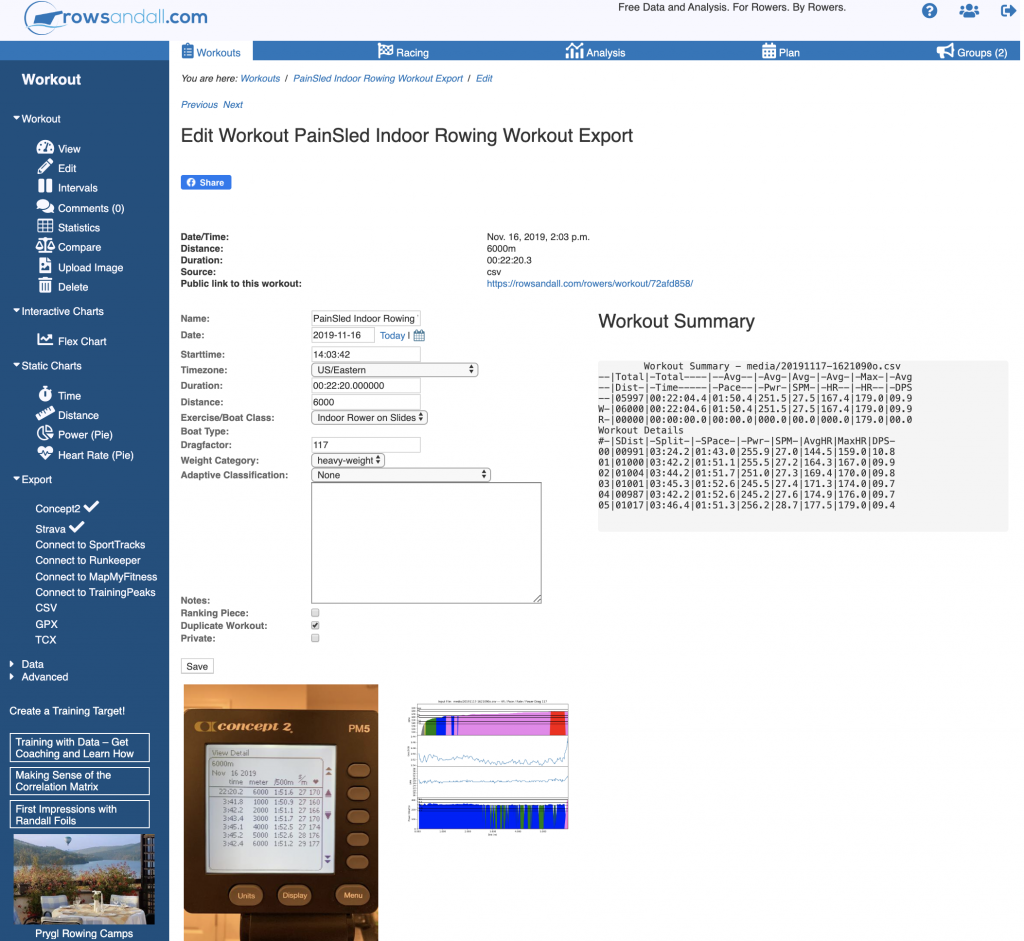
- If I click that link, I end up in the that entry to the logbook. Here’s what it looks like on my phone.
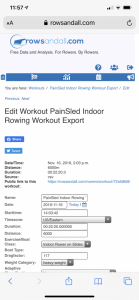
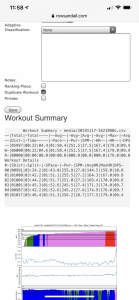
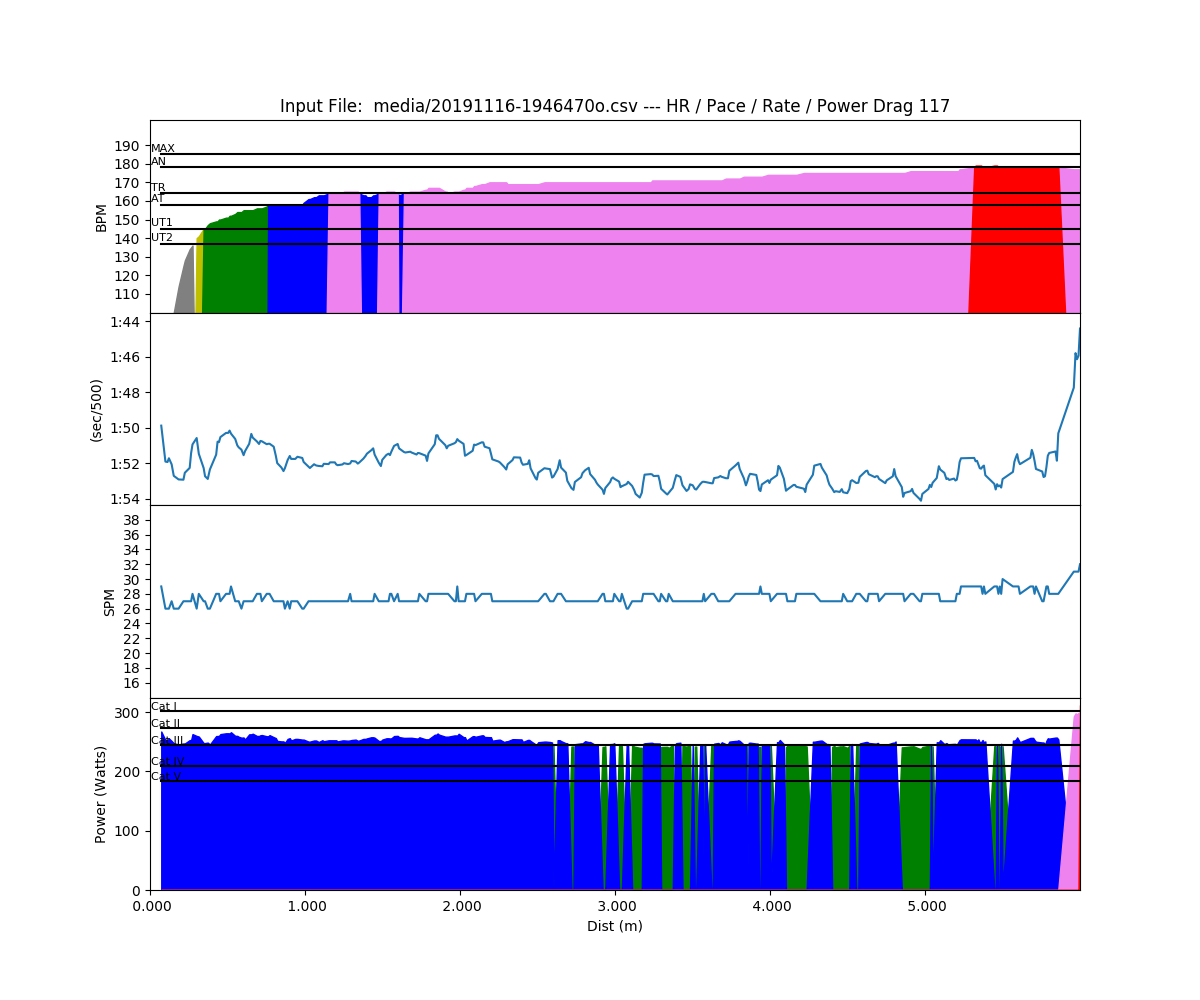
This edit page shows you all the usual stuff. A summary of the row and the plot that I generated from the command in my email. I really like the summary plot. It includes heart rate, pace, stroke rate and Power. The heart rate and power are colored by training zones, so it is easy to see if a specific workout lines up with training objectives.
And down the left side are the options of things you can do with the row
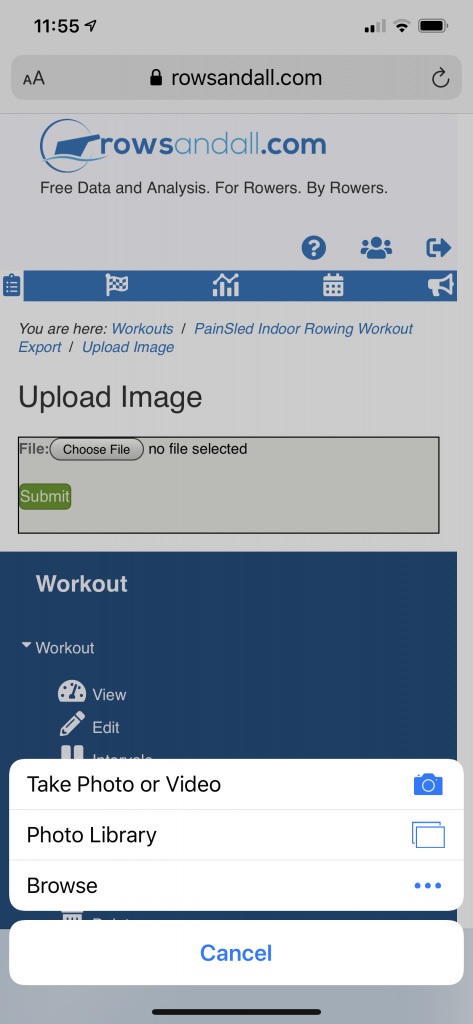
- When I do an “important session”, that I might want to rank, or refer to in a blog post, or on facebook, I like to include a monitor screen shot. So, I take a picture with my phone, and pick the “Upload Image” command, which let’s me pick the shot from my photos.
- If I look at the edit page on my computer, here’s what I see…
 Now I can keep that monitor shot with the workout and share it on facebook, twitter, or in my blog through a simple link.
 - If you look down the left hand command menu, in the “Export” section, you see that Concept2 and Strava have check marks next to them. That shows that I am exporting workouts to those websites automatically. Even though I use rowsandall as my main data hub. I still want to compete in challenges and rank workouts, so I want to keep my concept2 logbook up to date. And I really like the fitness tracking and social features on Strava so I export my workouts there too. Rowsandall handles all that for me in the background, so I don’t have to think about it.


The default starting place on rowsandall is the logbook view
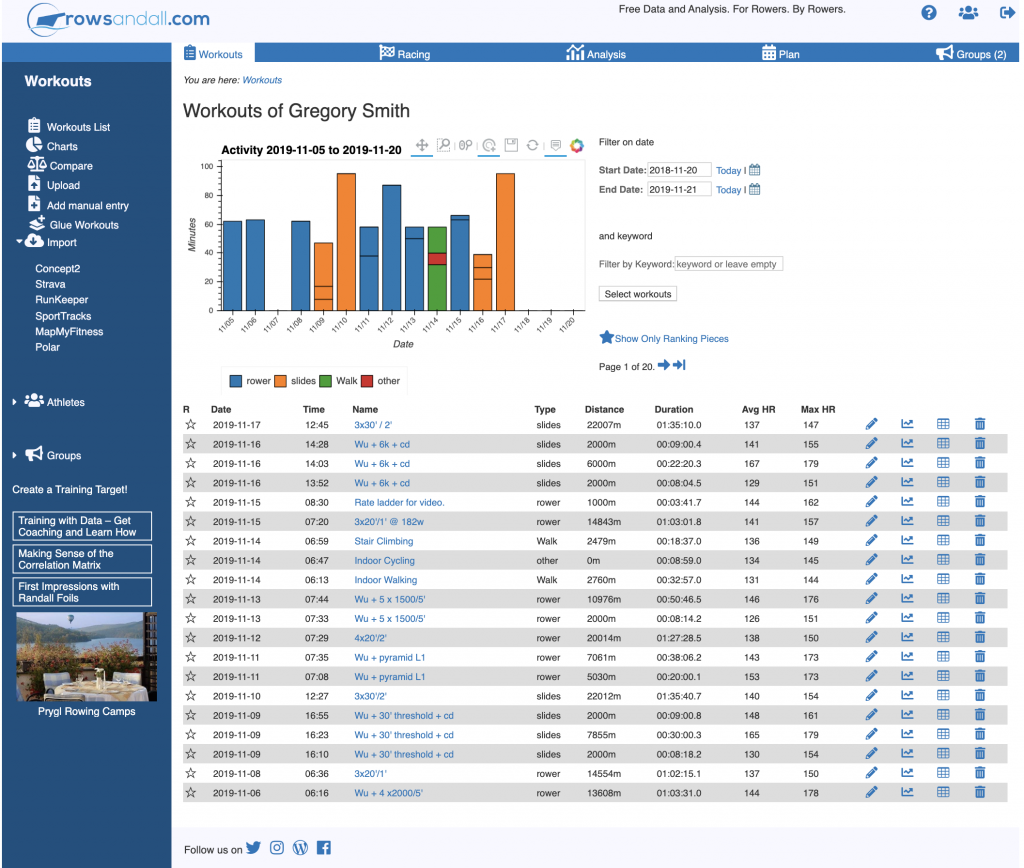
You can see some of the useful features in this view. First is the Activity plot up at the top. This gives you a quick summary of what you’ve been doing over the past couple of weeks. It codes them by workout type, so you can pick out certain sessions more easily. If you hover over any of the bars, it will give you some details on it.
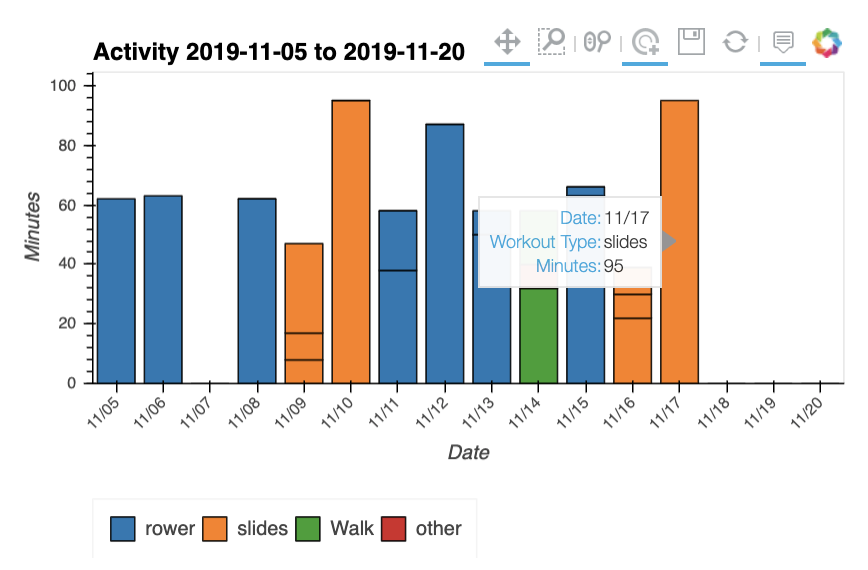
And if you click on the bar, it will take you straight to that workout’s edit page.
The logbook also provides some useful tools to find workouts.
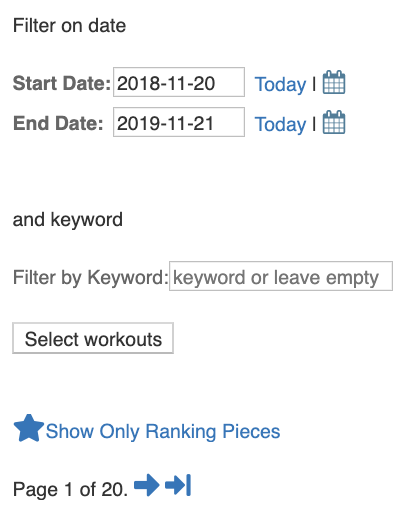
You can pick out a date range to look at, or filter on keywords in the workout description, or just look at ranked pieces.
There is good stuff in the entries too.
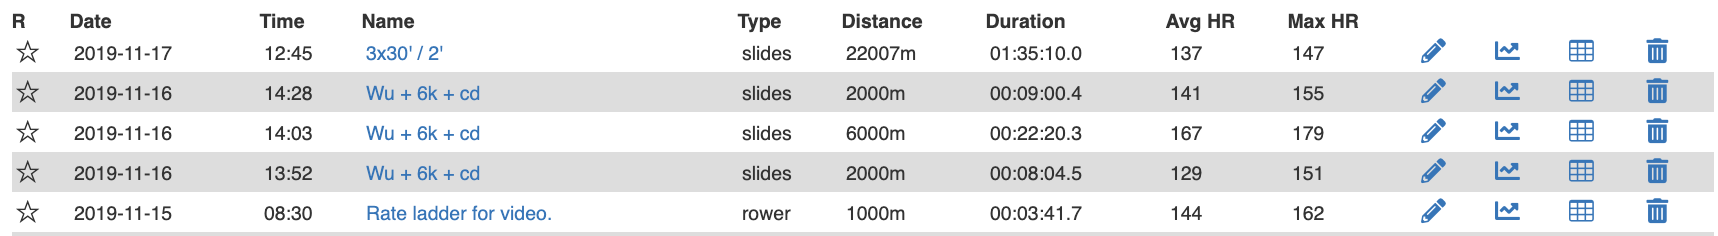
The “R” column is clickable so you can rank your distance. This is different from the concept2 rankings. It works for erg and for OTW, and it is the gateway to a bunch of tools to help you analyze your training and to use your workout data to predict performance on new sessions.
The Workout name is a link to that workout. And the distance, duration, and HR stats are pretty basic.
The next four icons get you to rowsandall tools.
- The pencil gets you to the edit page that we were looking at above.
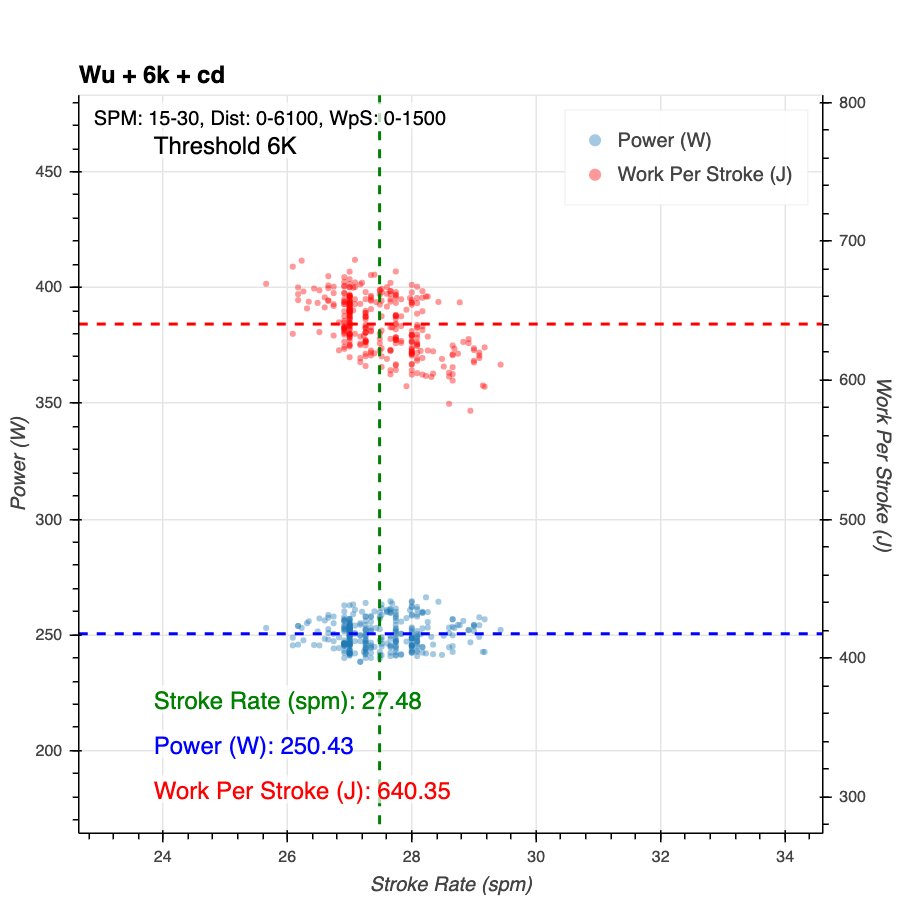
- The little plot icon gets you to a great tool called the flex plot that lets you look at any of the data that you have for the session in graphical form. Here’s an example from the 6K threshold workout that I logged, showing the tools you get in the flex plot.
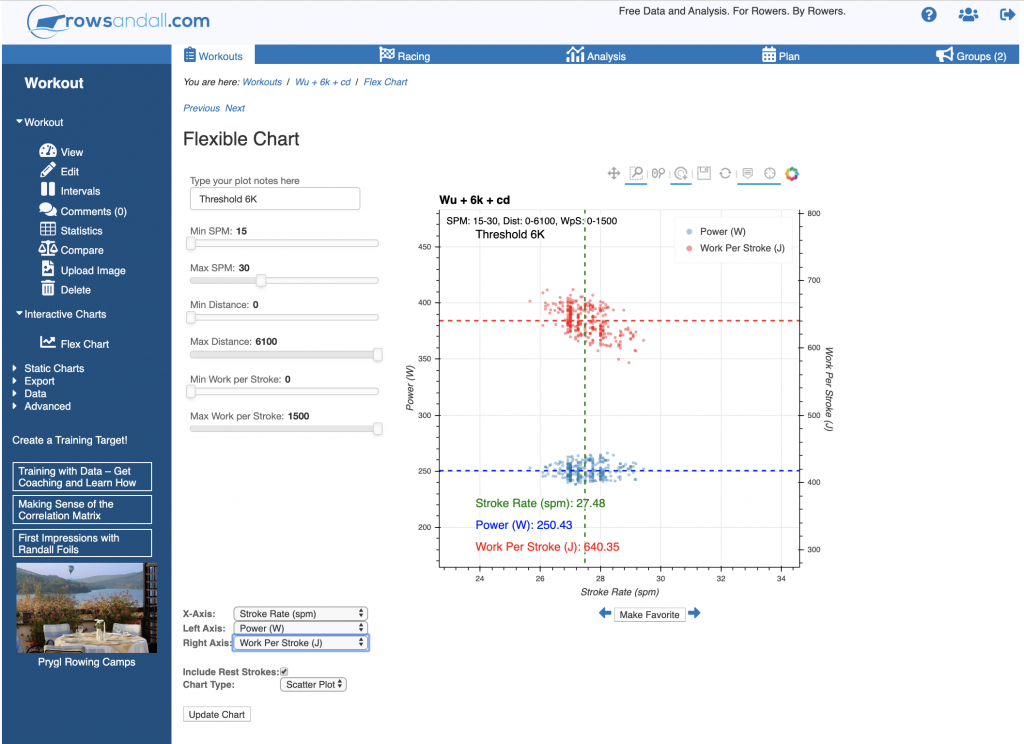
Once you are happy with the plot, you can export it to a file so you can share it or save it. This one showed how I was trading off rate against WpS to try to keep myself going. I was rowing to a target power (250W), and I was varying stroke rate and Work per Stroke to try to find the best groove for this row.
- The little table icon takes you to the statistics for the row. More numbers than you could ever want!
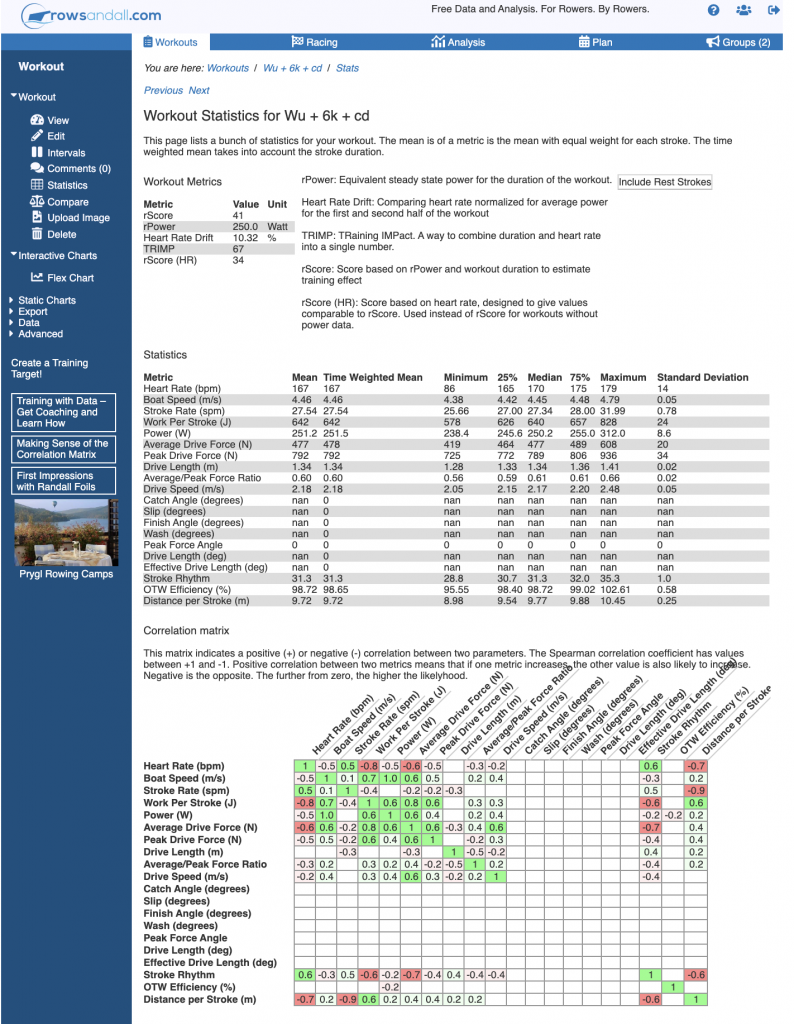
The stuff at the top is summary statistics for the row that show how hard it was. Then a statistical analysis of all the captured data for the row. I think this is useful because if you are going for consistency, looking at the standard deviation of certain values like peak force, drive length and stroke rate can be quite helpful.
Finally, there is a correlation table, which is, frankly, pretty hardcore. This shows how different metrics from your row are related to other things. If they are positively correlated, then you see positive numbers, and red for negative.

There are a ton of other useful stuff that you can do with rowsandall, but that’s enough for now. I’m planning to do some more of these quick articles to explain other capabilities over the winter, so stay tuned.