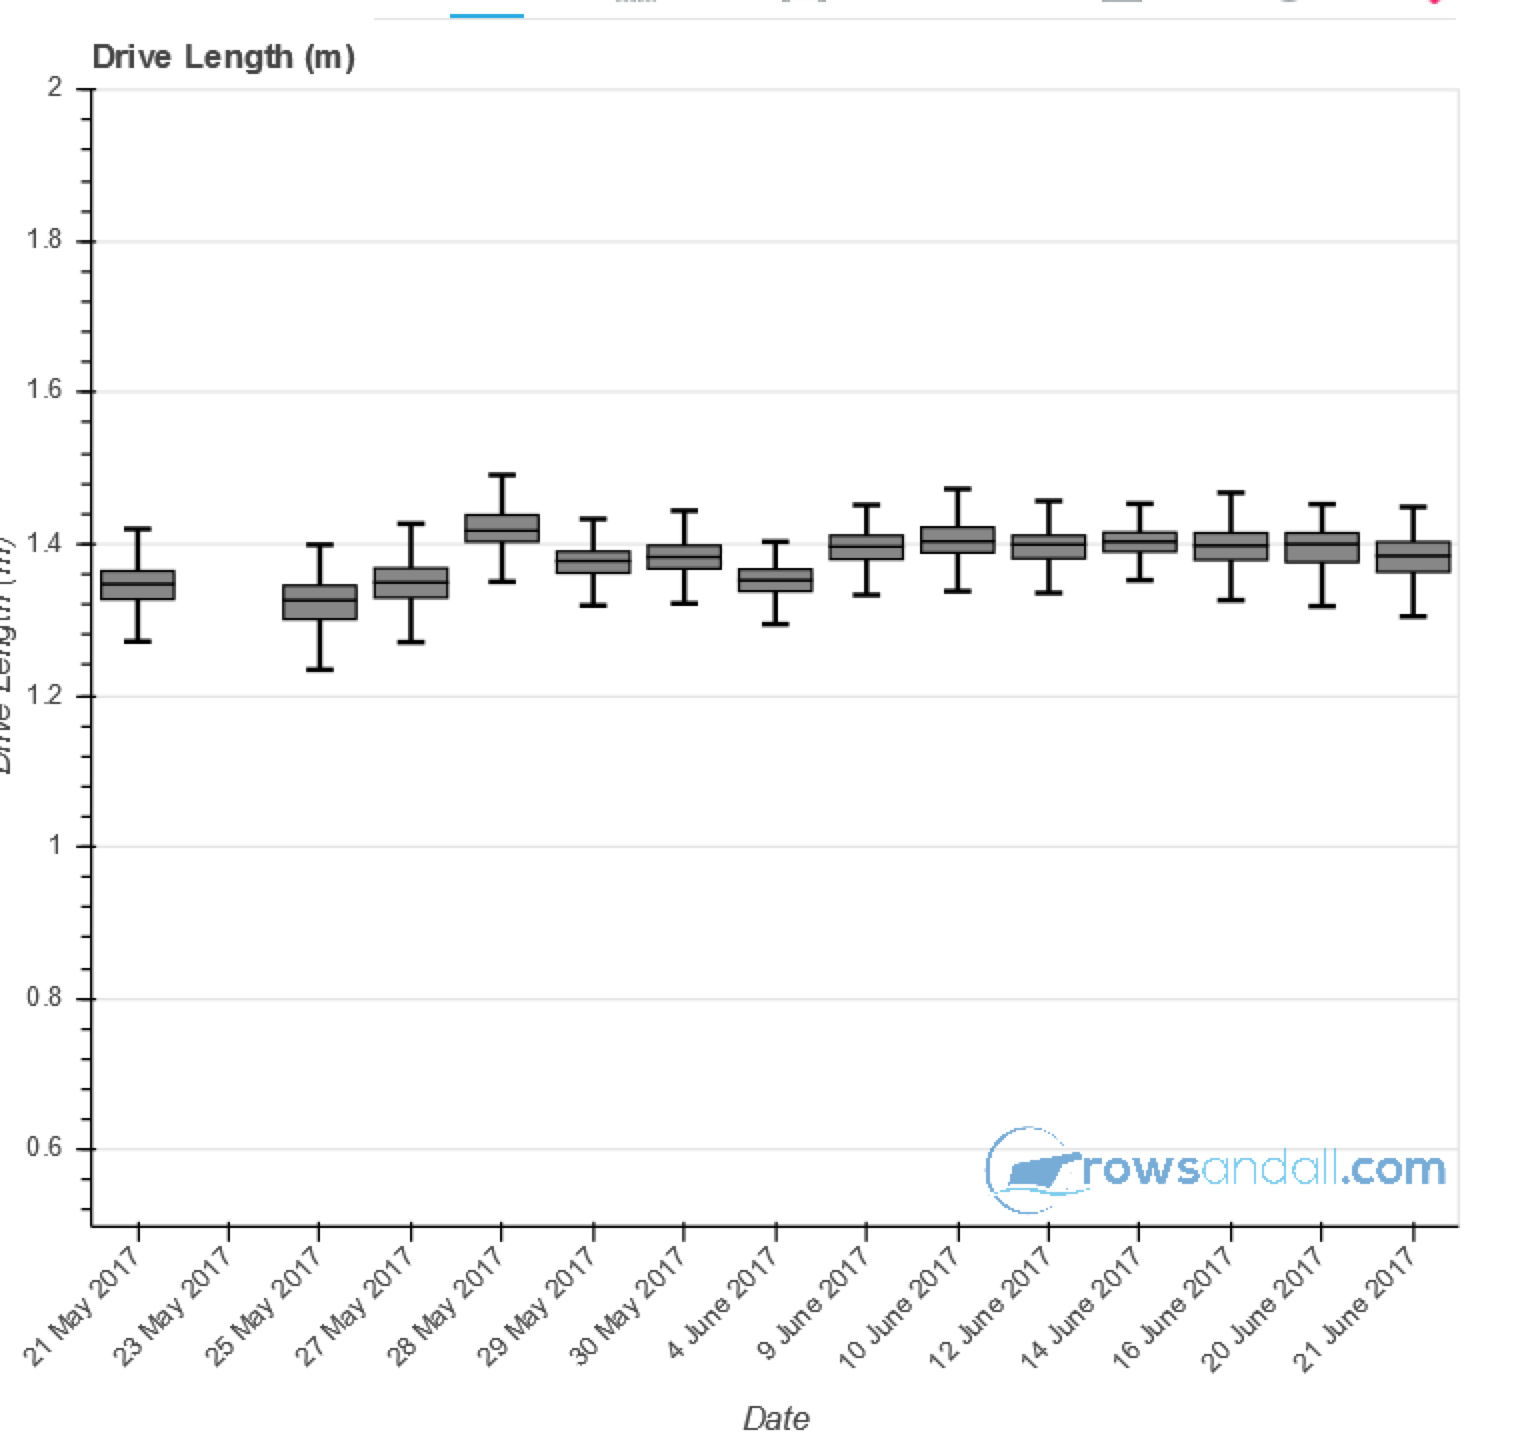
Recently, I had a discussion with one rowsandall.com user about erg technique. We discussed holding a certain power consistently and the role of a consistent stroke length in that. One of the differences between beginners and seasoned rowers is that the latter are able to row a very consistent stroke. Stroke length is consistent from stroke to stroke. This is extremely importsnt for good on the water rowing, but it also helps getting the best out of your erg workouts.
Our user went back to his records on rowsandall.com and made two charts. He looked at consistency of stroke length in June 2017 vs June 2016.

The above is the box chart for June 2016. And this is the result for June 2017:

You can see improvements on all fronts:
- The strokes are longer. Most of the 2017 rows are close to 1.4 meters. A year ago, our user was well below that most of the time.
- The variation from day to day was much bigger in 2016. Look at the day to day jumps in the median stroke length (the line inside the box)
- The consistency inside a workout is much better in 2017. You can see that from the size of the gray box, which is much smaller for the 2017 chart. Half of the strokes are inside that box. And looking at the distribution of stroke length of all strokes by eyeballing the length of the ‘whiskers’, you can see the improvement
