
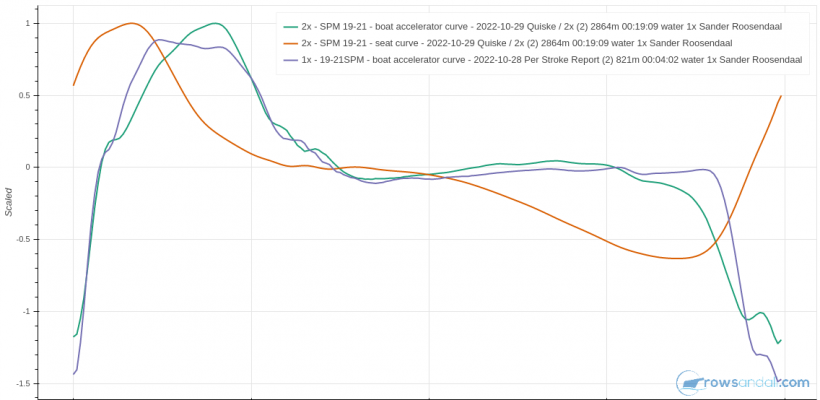
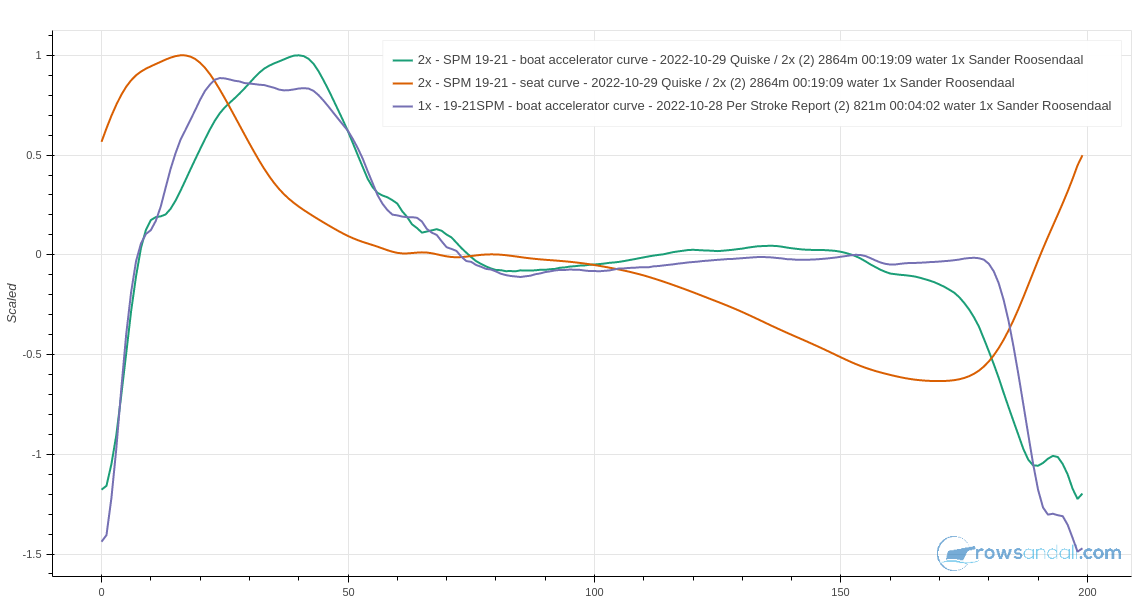
The two charts demonstrate new functionality on Rowsandall.com.
In the top chart I am comparing boat acceleration and seat curve analysis from the Quiske app, for two different workouts.
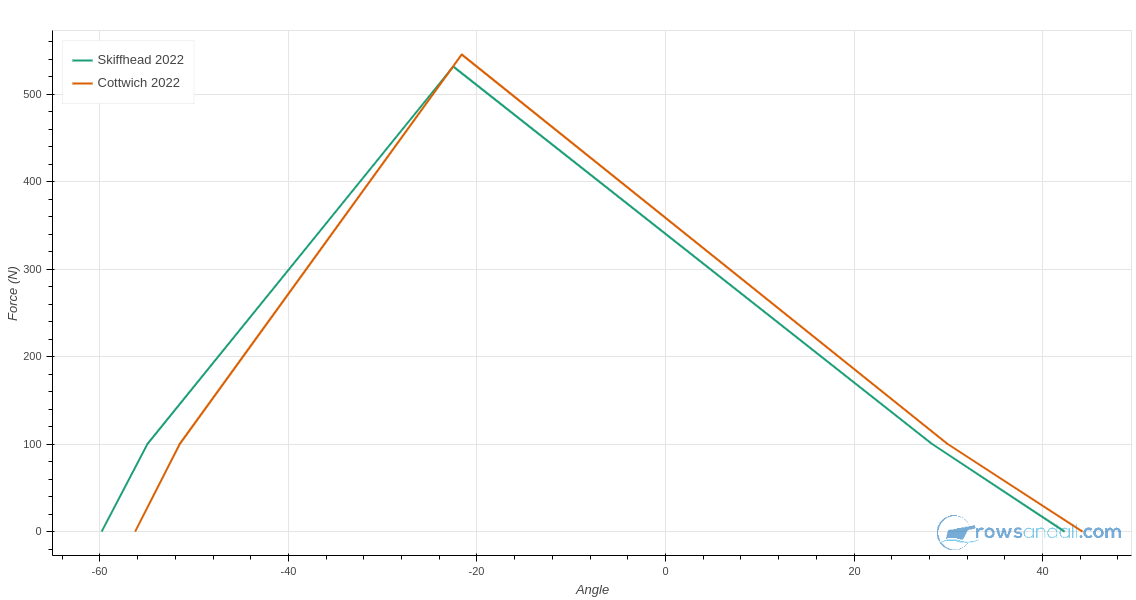
In the bottom chart, I am comparing my stroke force profile (measured with NK Empower Oarlock and NK SpeedCoach), for two different races this season.
Both charts have something in common. On Rowsandall, it was already possible to compare metrics like stroke rate, power, boat speed, etc between workouts. It was also possible to take a single workout and plot a stroke force curve plot, or take a single Quiske data set and look at acceleration or seat speed averaged over all strokes of a workout, or even a subset.
However, it was not yet possible to compare such average stroke profiles between workouts, or to put Seat Speed in the same chart as Boat Acceleration. This is now fixed.
To enable that, I had to add the concept of “Saving an Analysis”. You go into a single workout and look at the force curve, making a selection for a certain subset of all strokes (a certain part of the workout, or a range of stroke rates). Once you have set the selection parameters such that the chart shows what you want to discover, you can hit the (new) Save button.
Under the “Analysis” menu, there are now two new menu items: In Stroke Analysis and Force Curve Analysis. For example, the force curve analysis page looks as follows:
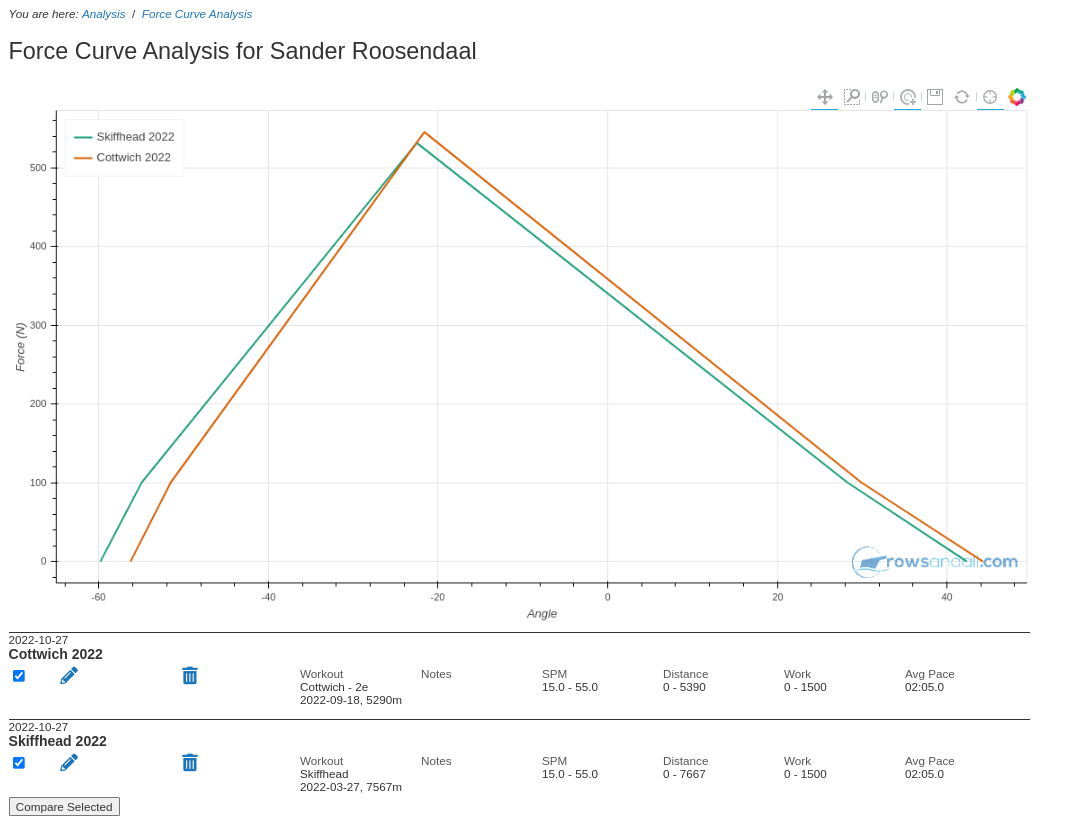 This is the place where you can manage your saved analyses, edit or delete them, and make comparison charts of as many in-stroke analyses as possible. The In-Stroke Analysis currently supports force curve analysis for data collected with Quiske, but also RP3 erg. The Force Curve analysis supports the Empower Oarlock.
I hope that Rowsandall users will like these new features, and of course you are always welcome to give feedback!