
Quiske offers innovative “rowing pods” that can be used on the erg and on the water to measure the dynamics of your stroke. Combined with the Quiske app on the water you can get instant feedback on
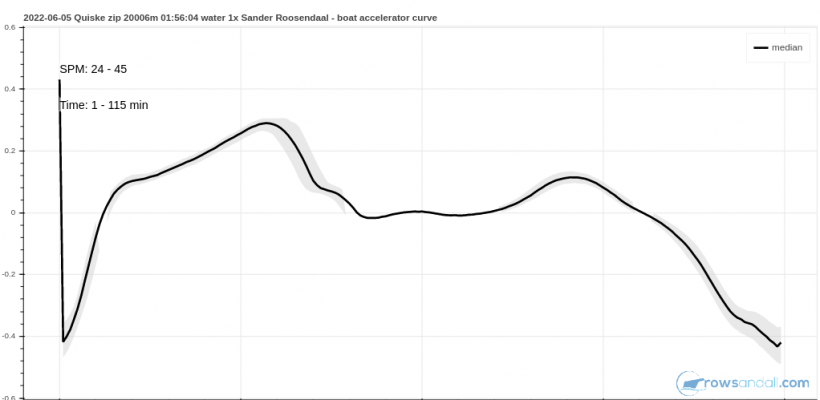
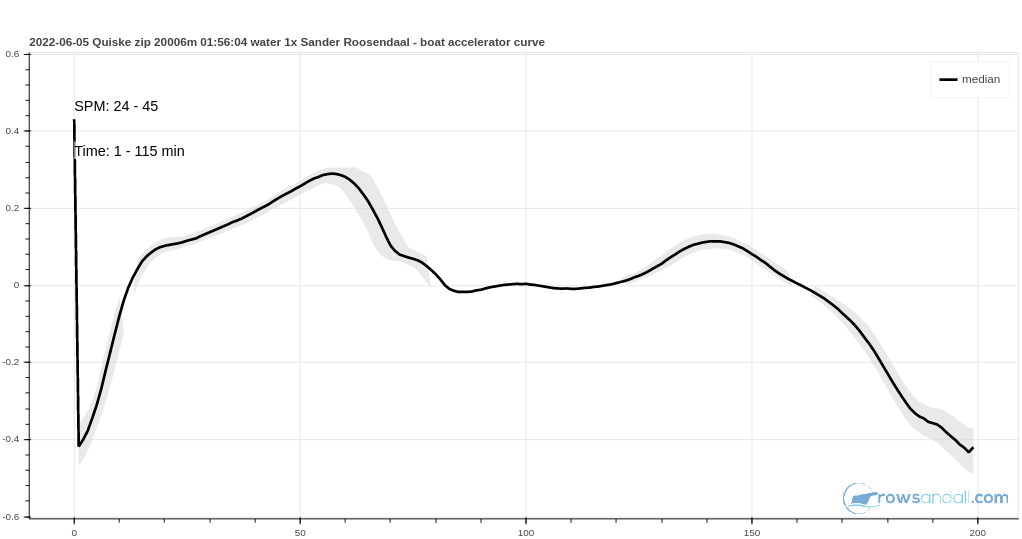
- Boat acceleration
- Seat velocity
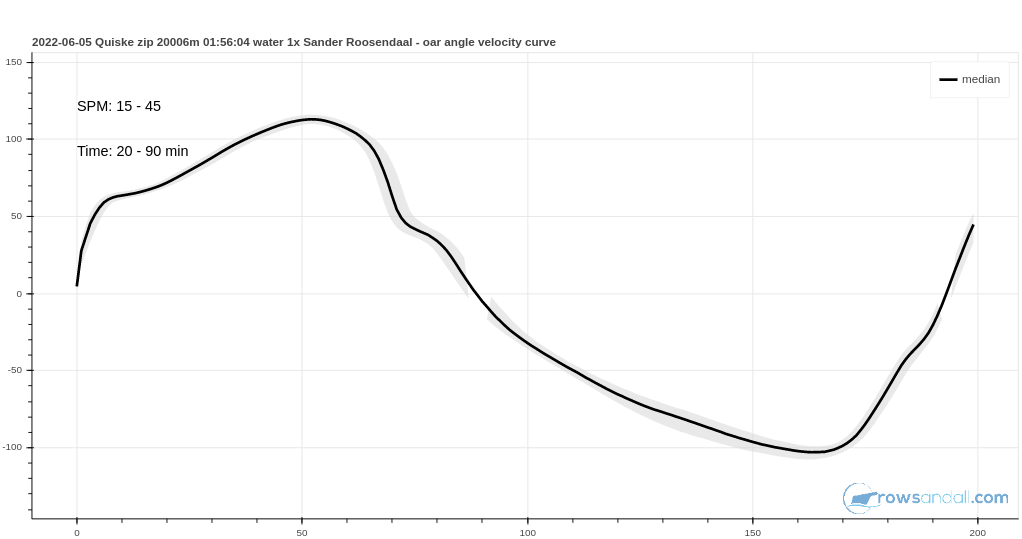
- Oar angle curve
On the erg, the pods can be used to give feedback about your rowing technique.
When Rowsandall.com was discussing with Quiske recently, we learned that they are retiring their data portal, focusing on the app and pod. As a long-time Quiske user, I regretted not having a place to store my analyses, and as the developer of Rowsandall.com, I saw an opportunity to build a replacement. So the idea came about. So we have started implementing the idea and are now releasing the first version.
You can now:
- Export your Quiske files to Rowsandall.com. You can send the zip files directly to workouts@rowsandall.com and they will automagically appear on your account if the from-address of your email is the same as the one linked to your account. Alternatively, you can manually upload the entire zip file.
- Look at your “in-stroke metrics” recorded with Quiske on Rowsandall.com
- Analyze these curves by narrowing down the time and/or stroke rate
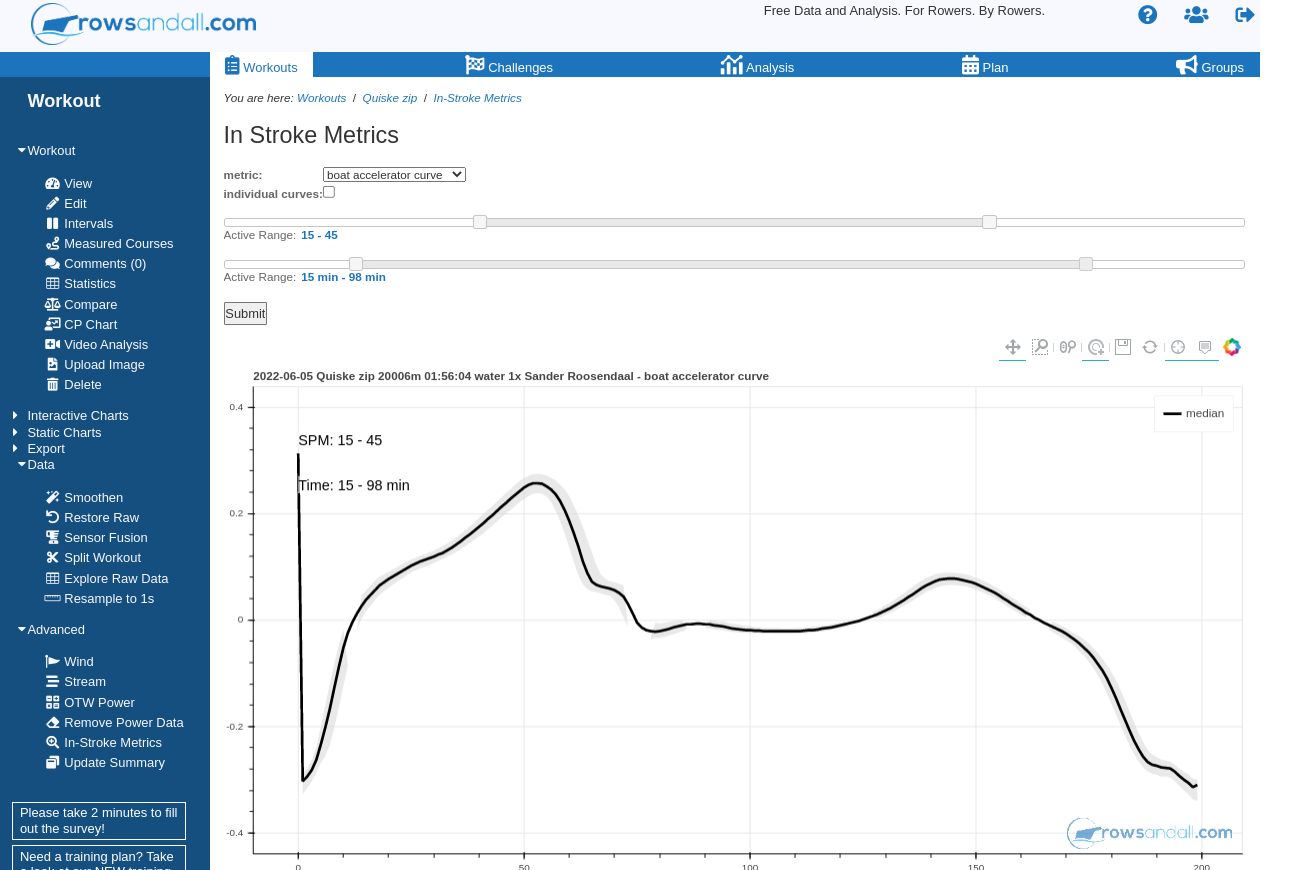 Here is how it works. After you upload or email your Quiske files to Rowsandall.com, they will appear as a normal workout on the workouts list. Under the “Advanced” header on the workout menu (left on the picture above, click on the image to see a larger version) you can select “In-Stroke Metrics”, which will bring you to the In-Stroke Metrics page.
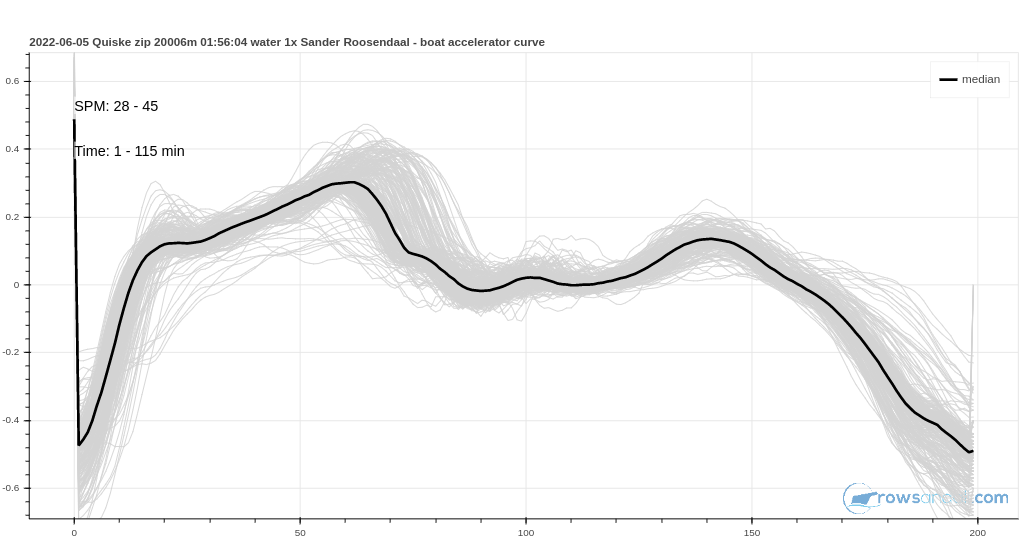
Here you see, from top to bottom
- A selector of the metric (in the example above I can choose between “boat accelerator curve” and “oar angle velocity curve”)
- Select if you want to see the average and confidence interval or average curve and all individual curves. The confidence interval shows you where the majority of the curves fall.
- Two sliders where you can set
- minimum and maximum stroke rate
- start and end time in minutes
- The resulting curve itself
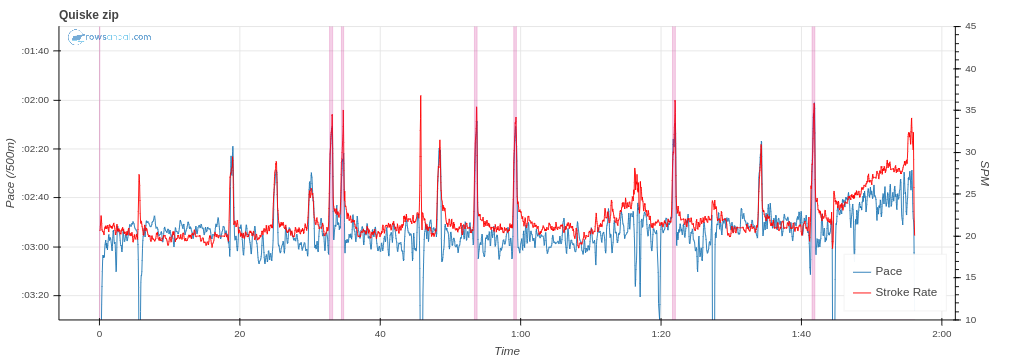
- A chart of stroke rate and pace vs time for the entire workout, indicating the strokes that were selected for the resulting chart.
All charts can be saved to png files, so you can share them on social media, by email or on your blog.
Play with the sliders and see the results. It will be self-explanatory. Here are a few examples (click on the images to see larger versions):


We’re planning to expand this functionality. Here are a couple of ideas that we are planning to implement:
- Save an analysis so you can later come back to them
- Compare saved analyses
- Merge Quiske data with SpeedCoach data
- Any other useful suggestion from our users!