
Rowing data add a new layer of information for coaches to benefit from. The ease of sharing rowing data online enables a new form of remote coaching.
Rowsandall.com is morphing into a tool for remote coaching of individual rowers. Sander describes how he became a remote coach to test the functionality of the site. Using data, he was able to remote coach a Masters sculler on a different continent, improve the athlete’s strength and fitness as well as make some key technique improvements. In the end, the athlete was able to peak at his first 1k race. The article describes how rowsandall.com was used as a platform for remote coaching and discusses some future improvements we will implement.
Introduction
Since the beginning of my second rowing “career” as a Masters rower, I have had great interest in rowing with data, building my own training program and measuring how well I executed it. When I moved on from Excel and started using proper data analytics tools to capture my data, it became quickly clear that a web based tool would enable many users to benefit from my work.
Now, we have rowsandall.com and we can easily share workout data with the world. This is a great help for coaches who can move from an intuitive, subjective approach to a data driven, factual approach to improving their athletes’ performance.
Many Masters rowers are in a difficult situation where they want to improve their performance, but they are held back by lack of time, lack of a proper training plan, and lack of coaching. The use of rowing data has the potential to change all that. Easily sharing data with your coach also means that your coach doesn’t necessarily have to be located near you. Therefore, I am adding functionality that helps remote rowing coaches to work with their athletes, and helps the athletes work with their coaches, training plans, workouts, and technique metrics.
I am a big fan of cooks eating their own cooking, so I had to test drive my remote coaching modules after I expanded them earlier this year. A willing subject was found and I started remote coaching him using my own web portal as the platform. Of course, tens of usability improvements were immediately identified and implemented, which I would not have found without using my own product from the coach’s perspective. It also allowed me to define future new functionality which will further enhance both the coach’s and the athlete’s experience. So here is what I did.
Assess athlete’s profile and define initial training plan
My experimental subject is a 65 year old male rower from the USA. He wishes to remain anonymous, so let’s call him Pete. Pete has a long history race rowing on the water, both in Olympic shells and in coastal boats. He has been using rowsandall.com to record his own training data (on the erg and on the water) and, when we first started to collaborate, was using the Concept2 Interactive Training Plan to prepare for a 2000m ergometer race at the end of February.
Pete’s goal for our experiment was to prepare for a 1000m on-the-water (OTW) sprint race in his single, which would take place in the middle of July.
The hardware we would have available to capture data was a Concept2 erg (with PM5, on slides) with Painsled to capture all the erg stroke data, and NK Empower oarlocks with NK SpeedCoach on both his boats (a coastal single and an Olympic single).
Normally, when starting with a “fresh” athlete, you would let him do a series of ergometer tests to determine his fitness and power levels. As Pete was already recording all his sessions on rowsandall.com before I started coaching him, we already had the data and I could assess his fitness right away.
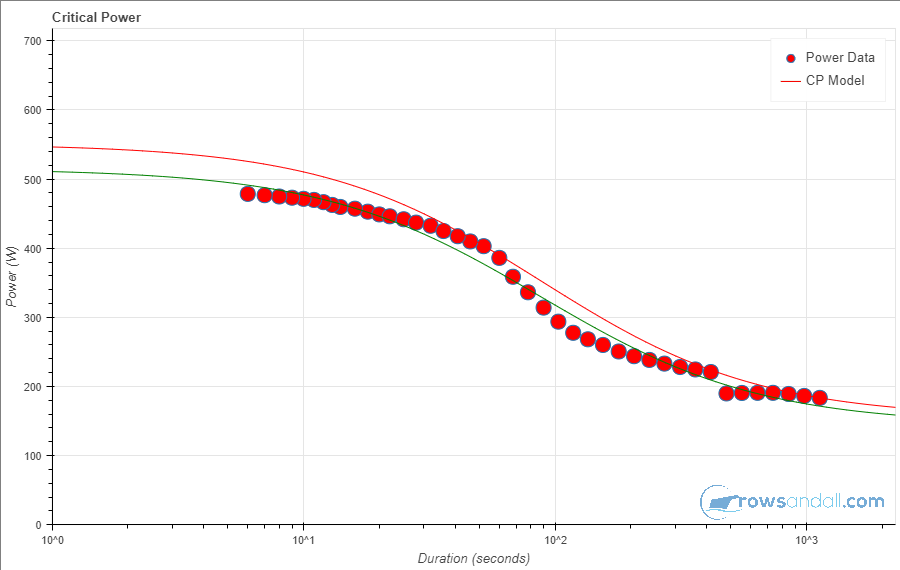
With three mouse clicks, I dialed up the Critical Power chart shown above. I used it to create pace and power guidance for the different sessions I would put into Pete’s plan. Pete’s fitness placed him around the 65% percentile for his age/gender/weight group, i.e. he would row a 2k faster than 65% of the active rowing population. It’s really important to get the training intensity and volume right for people of this age and fitness level. As people get older, recovery takes a longer time, and taking intensity and volume up too fast will only lead to accumulated fatigue and increased risk of injuries. We also were able to set realistic goals for the races based on real data. We wanted to make competing in regattas more fun for Pete by increasing his fitness to a level where he would be able to beat some of his peers.
Then it was a question of working backwards from the target race in July and determine high level goals for each month of the plan. I added a good block periodization and wrote down some guidance notes for Pete to make sure he was executing the sessions as I intended.
I also looked at his ergometer stroke metrics as captured with the Painsled app and noted two things to work on:
- Pete’s Work per Stroke was low and it was inconsistent
- Pete’s Stroke Length could be a little longer given his size, and it could be a bit more consistent
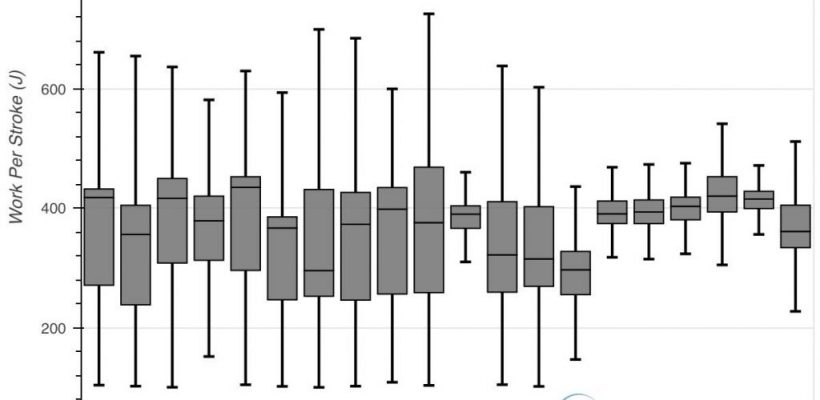
Look at Pete’s Work per Stroke (the red dots) for three months of rowing on the erg prior to our collaboration:
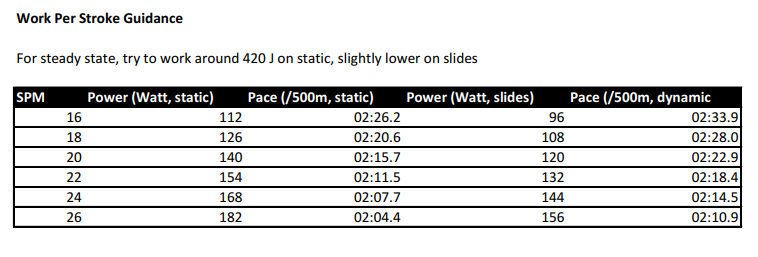
Here is the Work per Stroke guidance I gave to Pete:
Communicate weekly plan and measure execution
As I had Pete’s plan ready in an offline version, a few days before he would start rowing under my guidance, I entered the first week of sessions to Pete’s online plan. As this experiment started early March, the first month would be spent on the ergometer. The weather was too cold to risk rowing outdoors (and initially, Pete’s local rowing water was either frozen or too wild to safely row on).
Here’s an example of what Pete would see. As Pete is a busy man, he needed flexibility to move sessions to meet his work commitments. Rowsandall.com allows the coach to specify a preferred data and a “no earlier than” and “no later than” date range for each session.
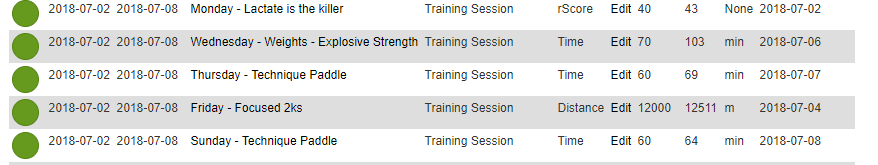 As Pete would execute the plan, the circles would turn from white to green for each well executed session, turn to an amber color for a partially or incorrectly executed session and turn red when a session was missed. Note that the coach can use distance, time, a power based “rScore” or heart rate based “TRIMP” to set a session level target.
The site also made it easy to create a weekly print out that included all the details. Here is an example of one session from the weekly print out.
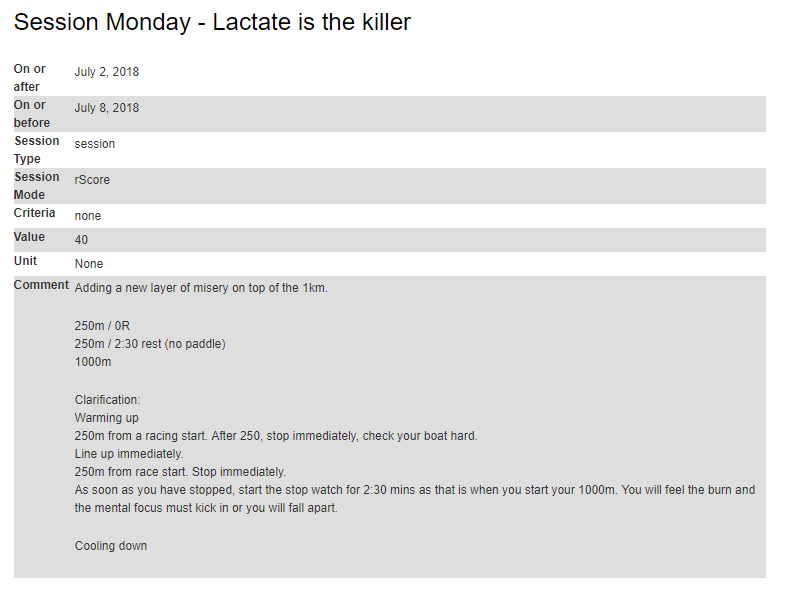
Pete printed this weekly print out and took it with him to his gym for reference.
During the week, I would look up how Pete had executed the sessions. I would focus on what went well (green sessions) and what didn’t go well (missed or incorrectly executed sessions). As Pete’s coach, I had access to all the data that Pete had uploaded and could do stroke by stroke analysis of his workouts.
As the program moved on, we would have weekly email exchanges discussing the progress and tactical changes like shuffling sessions around in the week to accomodate for Pete’s work schedule and the weather.
Improving Strokes
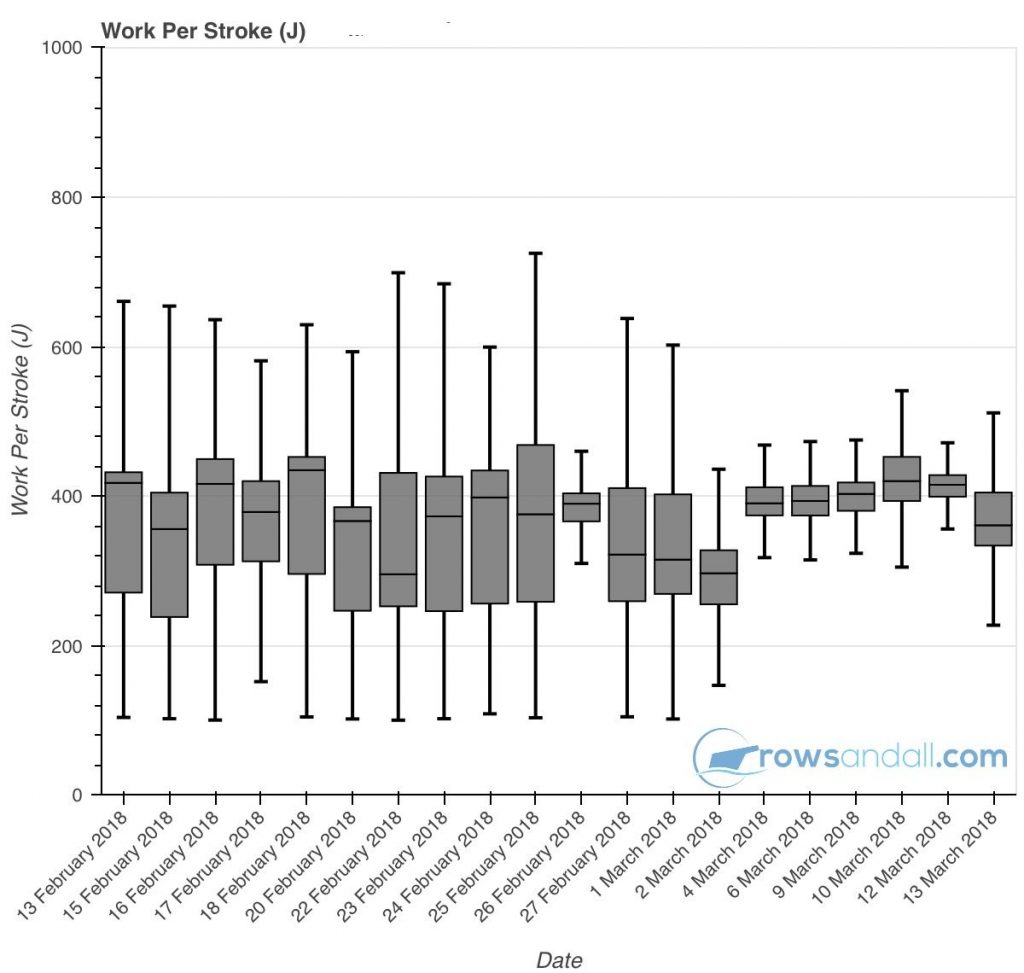
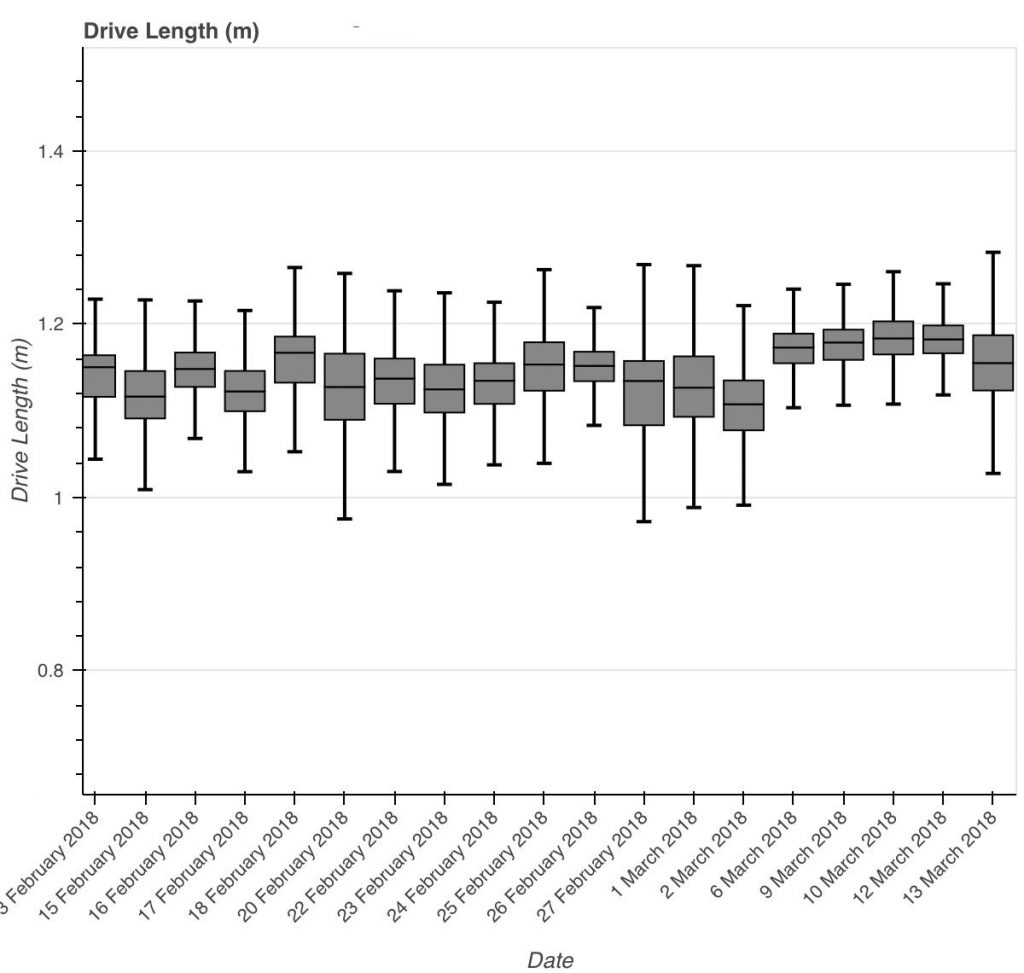
The two charts above were made a few sessions into the training plan. They show the Work per Stroke and Drive Length per session as a box plot, indicating the mean, and the dispersion of the metric over time. Guess when we started working on drive length and Work per Stroke? These charts are ideal to monitor in-session and session-to-session consistency and Pete was a good student.
In the mean time, he also got me some video of his rowing on the erg. I used an object tracking software to annotate his hand movement and back position and sent a few stills back:
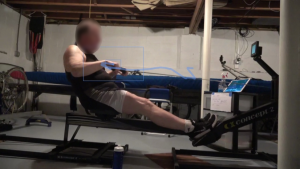
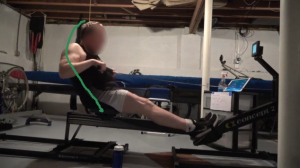
The video was great to discover the root causes of some of Pete’s stroke metric values, enabling me to give Pete some technique guidance. In subsequent sessions, I would monitor the key parameters and I could see his technique was improving. Of course, I could also look at each session’s detail to see how he was progressing. Here’s an example of a “Red Line” interval session:
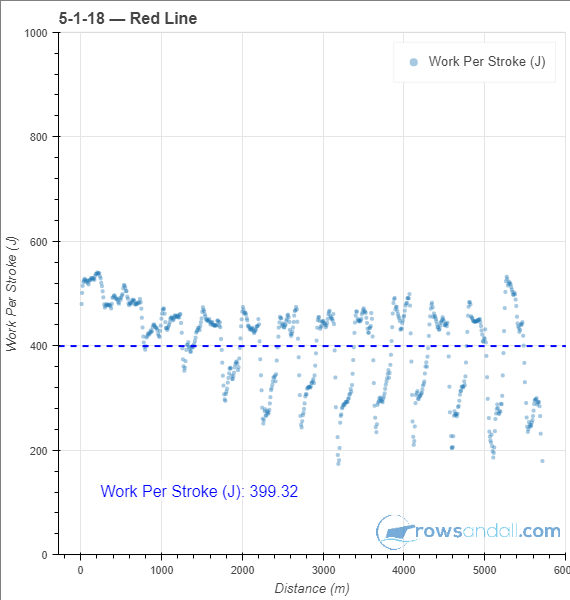
Note that the “Red Line” intervals have no rest intervals. What you are doing is a 6k where you alternate a pace that is slightly faster than sustainable (over 6k) with a pace that is just a tad lighter than the maximum sustainable pace. Stroke rate goes up and down with the pace to hold a constant Work per Stroke. It’s a pretty tough session.
The “Red Line” session is a pretty hard one as you are alternating race pace and “hard endurance” pace for quite a long time. You can see that Pete started out too hard, and wasn’t able to hold the Work per Stroke in the lower stroke rate intervals.
Based on the video, I also slightly changed the focus of his weights sessions, adding in some more work on Core Strength and Stability.
Changing goals and plans on the go
There were a couple of moments where Pete and I had to have a deeper discussion about the plan.
- After a few weeks, it was clear that we had been slightly too ambitious in terms of training load. This was clear from the session execution and Pete was reporting increased fatigue in his workout notes. We quickly adapted to a more sustainable training load.
- The transition to water was later than anticipated and was complicated by the fact that the river was surging, creating a difficult environment to measure technique related metrics.
- After a few months, personal circumstances made it hard for Pete to commit to two test races that I had planned in preparation for the main event, and we had to reduce the number of trainings during a couple of weeks.
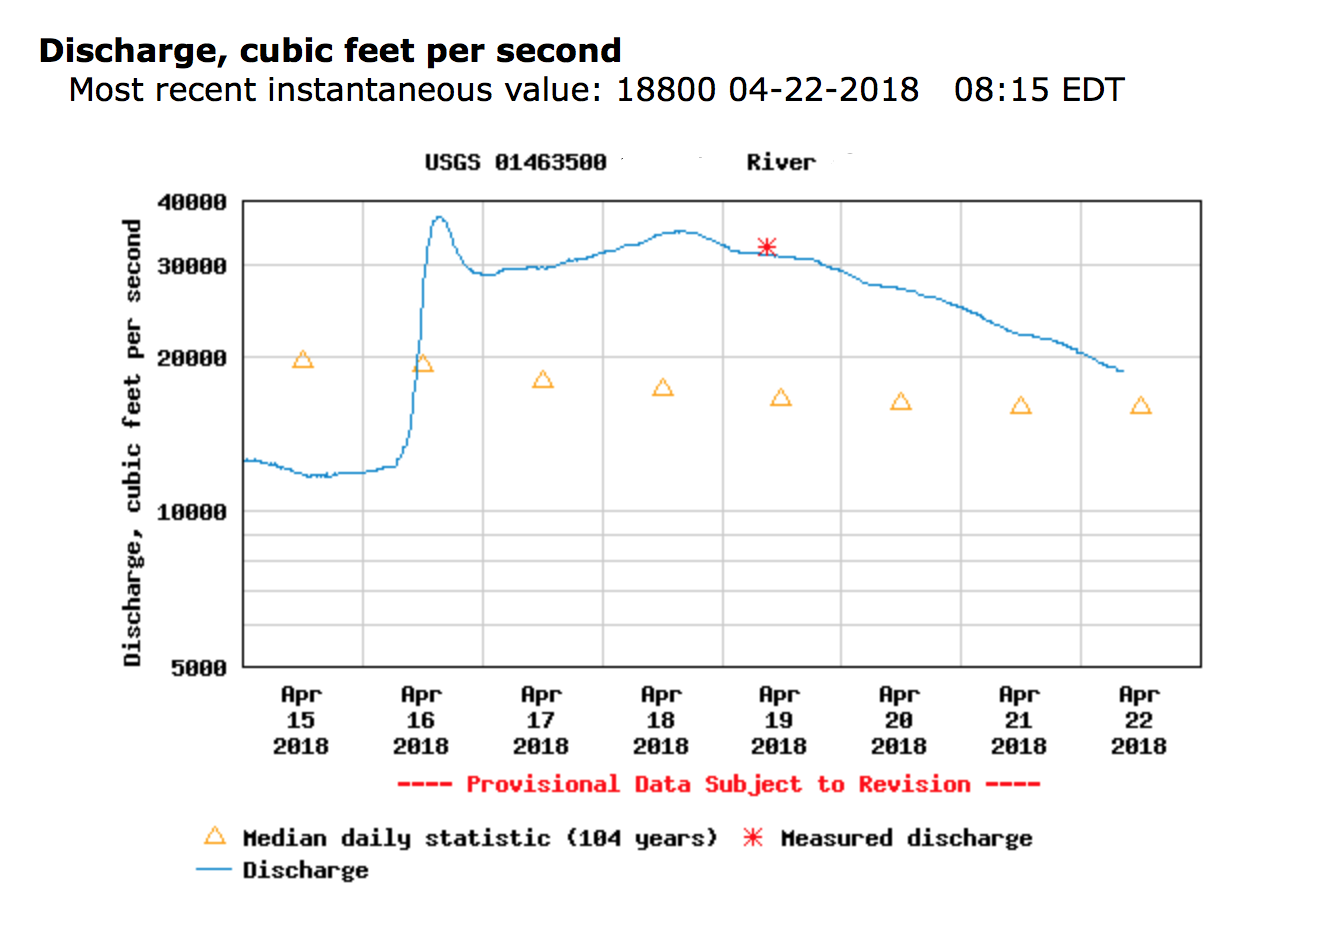
Here’s the water discarge on Pete’s rowing water. This made it difficult to get out on the water at all, and when Pete did row on the water, turbulence made it hard to work on stroke consistency or technique:
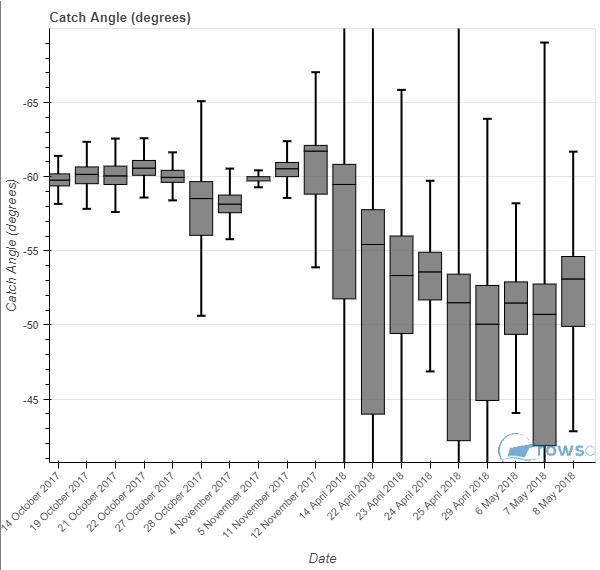
We can see from the box chart for catch angle that Pete was rowing pretty consistently during the fall, when the water levels were down, but it was impossible to do any meaningful workouts on the water during April and May. Eventually, a lot of the rowing workouts were done on the erg.
Box Charts Are King
It turned out the box charts were among the most useful remote coaching tools on the site. It gives the coach a long term perspective, helping him to assess that things are going in the right direction without being discouraged by the incidental bad session. Take this chart, for example, which shows a gradual lengthening of the catch as the athlete became more comfortable on the water.
Again, the “bad” values at the beginning and the end of this chart are due to the river being unrowable, but the middle part fo the chart shows a gradual lengthening of the catch by approximately five degrees over the summer and fall.
Measuring Progress
The charts above show a comparison of two 5k efforts at different times into the program. You can see the clear improvement in terms of average heart rate, race plan execution, and stroke consistency. In a few weeks, Pete had gained confidence in his capacities and was able to flawlessly execute his plan.
In his final regatta, we switched to a taper and did race specific preparations. When it was regatta time, Pete felt well prepared and we had a good discussion on the power level and rate to hold during the race. Pete performed as expected.
The athlete’s perspective
Here’s an excerpt from our email exchange after the final race. Pete:
For context, I have to remind myself that as recently as a few weeks ago I questioned if I should race at all. I was so frustrated with the training conditions and my lack of confidence in the new boat. This was a crash course in getting ready for my first regatta in many years.
It came together in the last few weeks and I really think the data-based remote coaching made a huge difference.
So, it looked like the approach worked. Here’s why, from Pete’s perspective:
- As I began to re-engage with competing versus just exercising on the river when I felt like it, I realized how much had changed in the years since I had competed seriously (1975 – 1983). For example, widespread use of the ergometer, and a much clearer scientific understanding of the biomechanics of rowing. I was on a journey of re-discovery of 40 years of learning. If I had continued to do that alone, I would need several years to catch up. By collaborating with Sander through Rowsandall.com I was able to significantly accelerate the learning.
- When you train on your own, as I was doing, you really don’t know if you are, “doing it right.” By capturing my actual data and using valid reference sources of best practice, Sander was able to guide me on what “doing it right” should look like. From there it was up to me to use that knowledge to inform and shape every session to accelerate improvement.
- Comparing the experience with Sander / Rowsandall.com (S/R) with earlier coaching experiences, it was too easy to dismiss the coach’s input as “just their opinion.” With S/R it would have been hard to disregard the input when you see your own data and have reference sources for comparison (even so I did try occasionally to deny 🙂 ). With S/R there is nowhere to hide. You cannot get off the water and make up some subjective but plausible-sounding story about the session. The data all correlates. If you were rowing short, it shows in multiple places. If you were letting the Work Per Stroke drop on your final intervals, there it is for all to see. If it was due to the water conditions, you will see that, but if it was due to the rower, you will see that too. On every stroke, I was conscious that S/R could always see me.
Conclusion
To make a fair assessment of the value of data, we have to contrast it with remote coaching without data. Without data, a remote coach has no more information than what the athlete tells him during a (video) call, plus perhaps some pace values for isolated test pieces, and a video now and then.
Using data enables the remote coach to look at every stroke with ease, almost as if he was standing next to the erg or riding along in a launch while the athlete is executing the training plan. This brings remote coaching almost to the level of real “face to face” coaching.
Without a platform like rowsandall.com, using data with remote coaching is cumbersome. The remote coach would have to spend a lot of time to process and organize the data. Rowsandall.com does all that for you. It has quick overview pages and at the same time enables you to dig deep when you need. You can quickly review your athletes everyday and focus fully on what is going on in the data, analyzing them, drawing conclusions and formulating recommendations: That is what brings value to your athletes.
Outlook
The remote coaching experience was a great one, and I am seriously considering taking a few more (remote) athletes into my group. If you’re interested, contact me at support@rowsandall.com.
Rowsandall.com is available for any coach and athlete who is interested in remote coaching. Contact me at support@rowsandall.com if you are a remote coach and want to know the possibilities.
In the few months of working with Pete, I have generated a large list of ideas to further improve the remote coaching experience on rowsandall.com. I am determined to gradually improve the site over the coming months. I won’t go into detail here, but all improvements are aimed at letting the coach (and her athletes) focus on what is most important:
- Planning for fitness and technique progress
- Monitoring plan execution and technique improvements
- Alerting coach and athlete on anything that requires their attention, whether they are at the plan, workout, or stroke level.