[amazon_link asins=’B074KG6G5Q’ template=’ProductCarousel’ store=’rowingdata-20′ marketplace=’US’ link_id=’82ebd6c7-a747-11e7-b155-d123b904e6f4′]
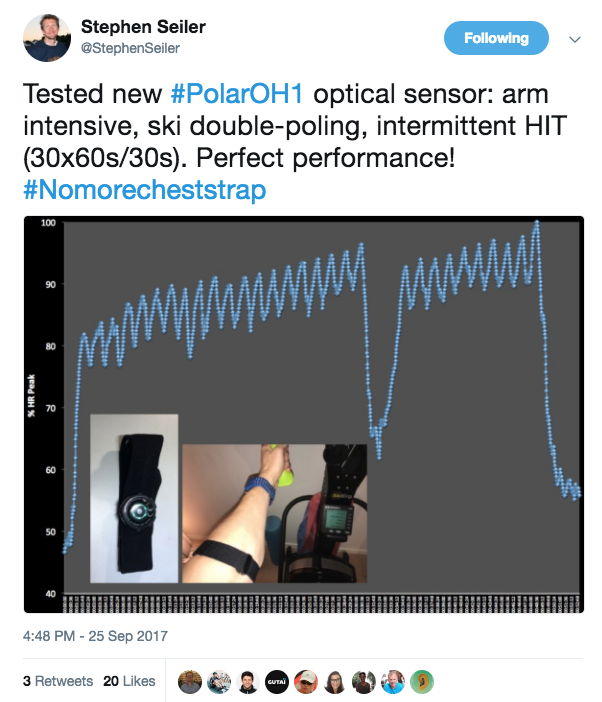
My old Wahoo Tickr died earlier this week. I bought a new one just like it as a replacement, but while I was figuring that out, I saw a tweet from none other than Stephen Seiler showing heart rate data from a polar OH1 taken during a skierg session. It looked good!
I thought that if it worked on the skierg, it stood a good chance to work for rowing. I’d be really happy with a HR solution that doesn’t require a chest strap.
So I bought a Polar OH1 too. Both the Tickr and the OH1 arrived last night. So today, I decided to do a side by side test.
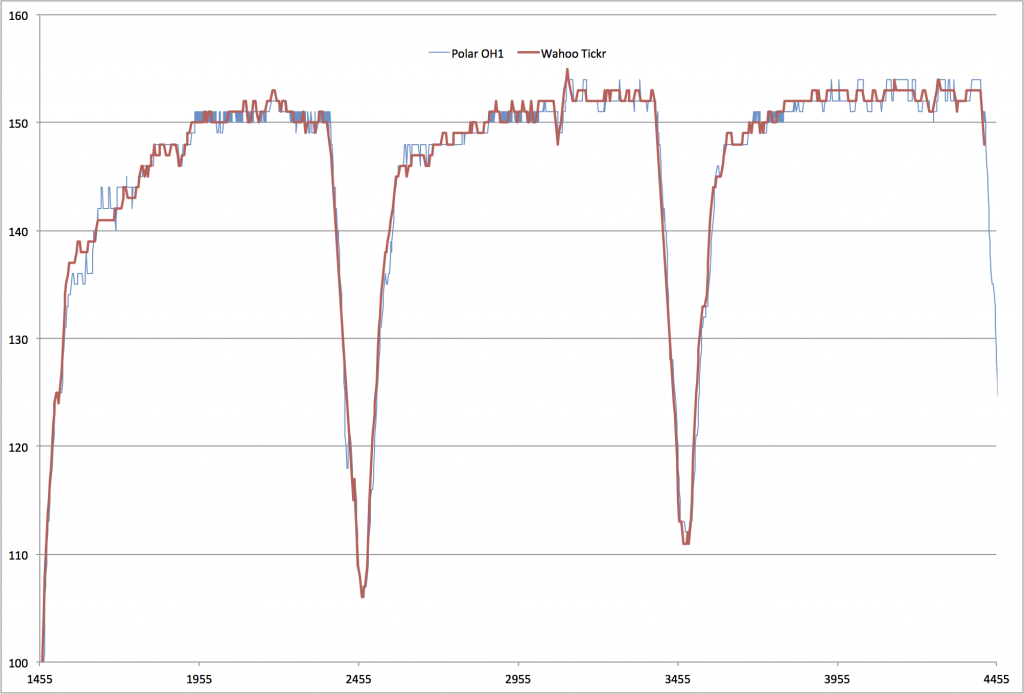
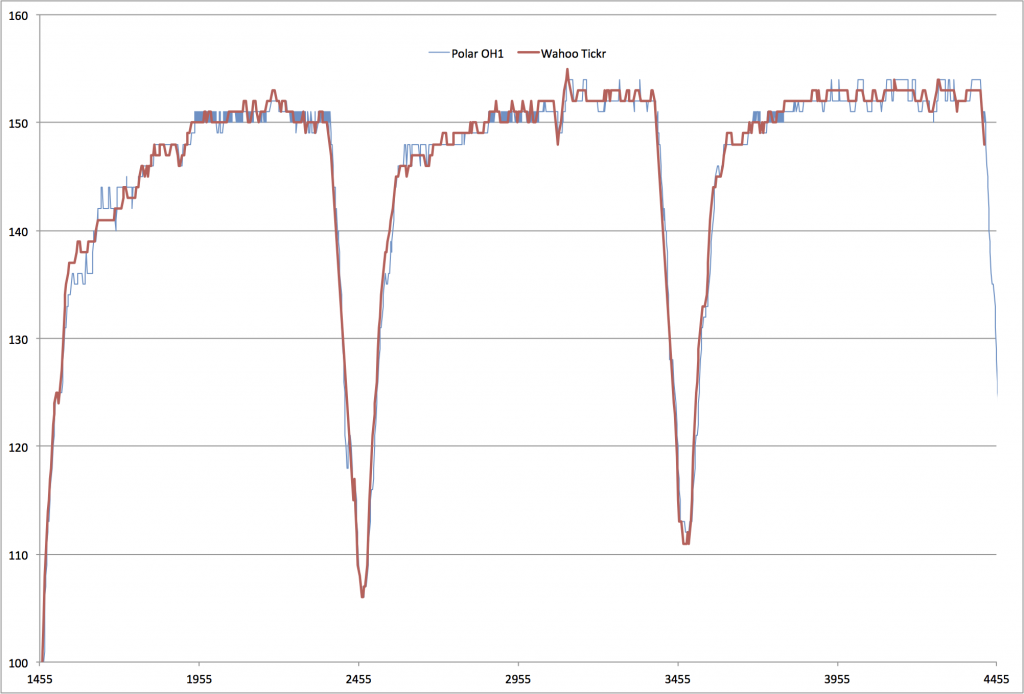
I wore the OH1 on my left forearm and connected it to the Wahoo fitness app, which logs HR once per second. I put on the Tickr and connected it using ANT+ to the PM5. I used painsled on my iPhone with the PM5 to collect HR, pace and rate data.
I was doing a tame 3 x 15′ steady state session. The correlation between the two sensors was very good!
I have to try this experiment for an interval session and on the water, but I am hopeful that I may be able to move on from chest straps!
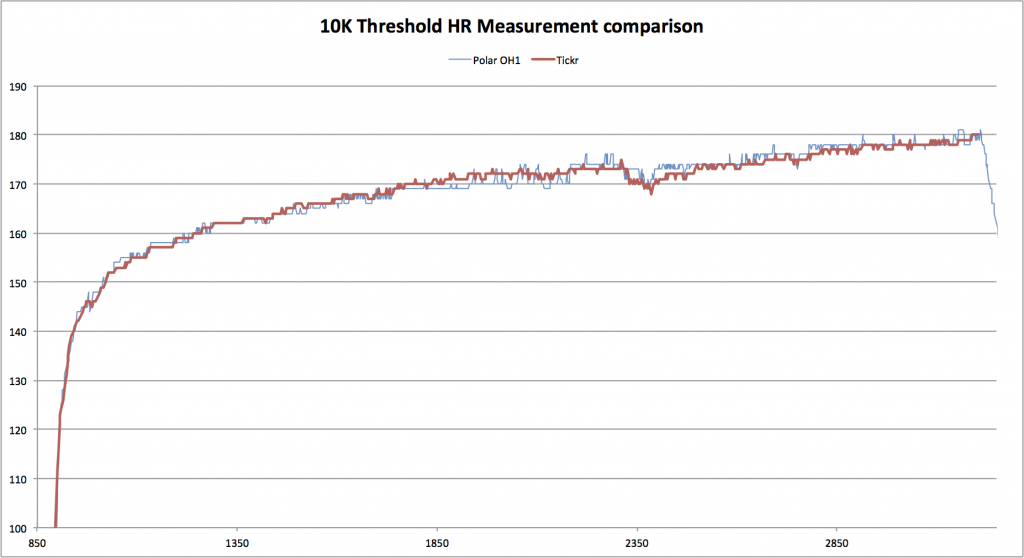
9/29/2017 – I did a hard 10K erg session today. The results were similar.
So, in this piece, I went out a bit too hard and I had a bit of a crisis around the 7K point. So the change in the HR recorded there is a real thing, and also looked like it generated the largest differences between the sensors.This is not surprising at all because the sensors must be running algorithms to recognize valid HR data from noise whicch have some degree of memory to them. It is unreasonable to expect them to behave exactly alike in these circumstances, and probably neither one of them is “right” in the strictest sense of the word.
The two data sets were close enough that I got intrigued. So I did an error analysis of it. The Polar OH1 data was sampled at 1 second intervals. The Tickr data was recorded on a per stroke basis, so roughly 2.5 seconds per stroke.
I simply selected the polar data point was was closest in time to the elapsed time of the stroke record. Then I took a delta between the two data points. Here is the result.
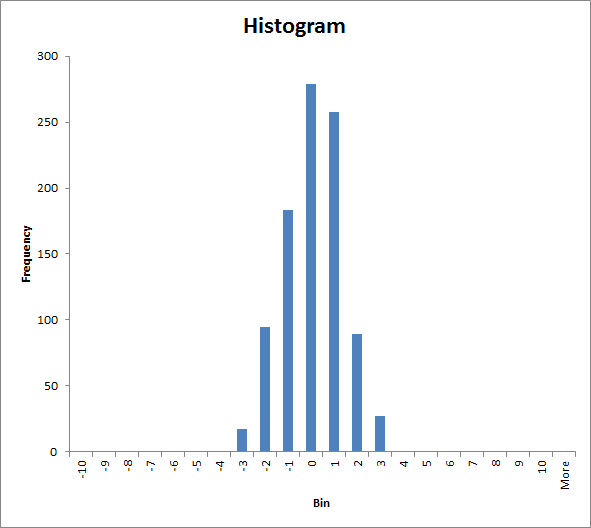
This provoked me to do a histogram of the errors to see how well behaved it was.
Looks pretty good to me. The mean error is -0.098 and the Standard deviation is 1.46. Neither sensor seemed particularly better or worse than the other.
