In the previous post, the Rowsandall.com Performance Manager was introduced, which tells you how your predicted fitness, fatigue and form are impacted by the workouts you do.
But how do you find out how good you really are? The traditional answer in rowing has been: Regular testing. This is where the dreaded 2k test, 6k test, etc come in. There is nothing wrong with a good erg test now and then, but what if there was a way to get a notion of how good you are from your everyday training?
This is where training by Power really shines. On the erg, we get power data for free. In the boat, you will have to invest in a power measuring oarlock, like for example the Empower Oarlock or the Active Tools RapidFit oarlock (coming soon).
Once you are measuring power, you can measure your Critical Performance, which gives you information on the power level that you can hold over various durations. With that info, it’s easy to compare with other athletes of your age, gender and weight class. In 2018, we published a series of articles on aging and rowing, and recently we’ve implemented an absolute score based on what we found in that study.
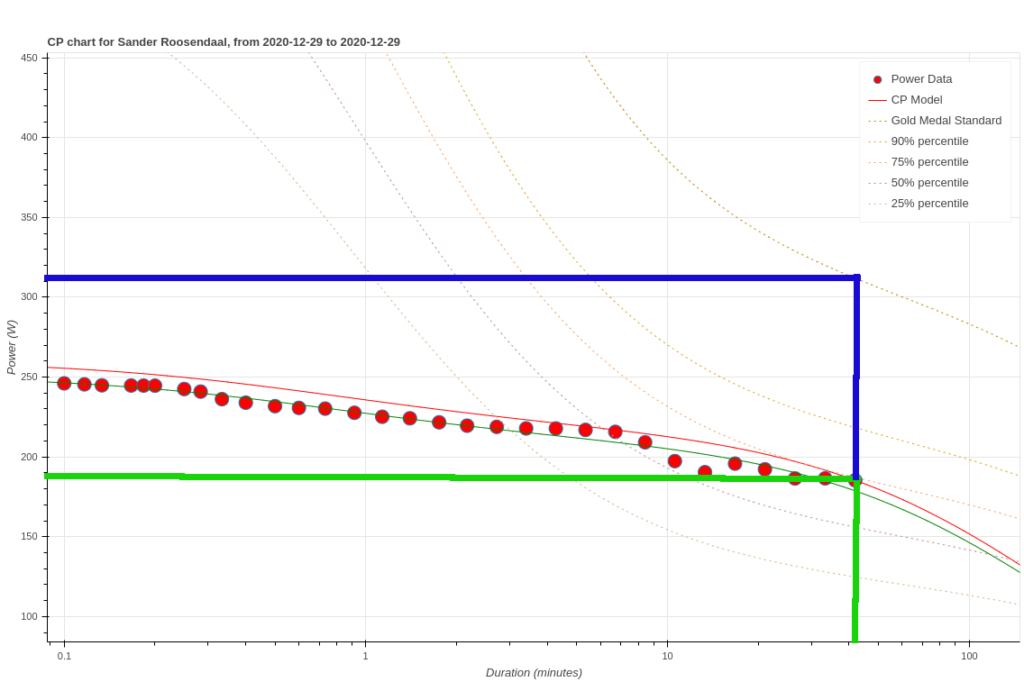
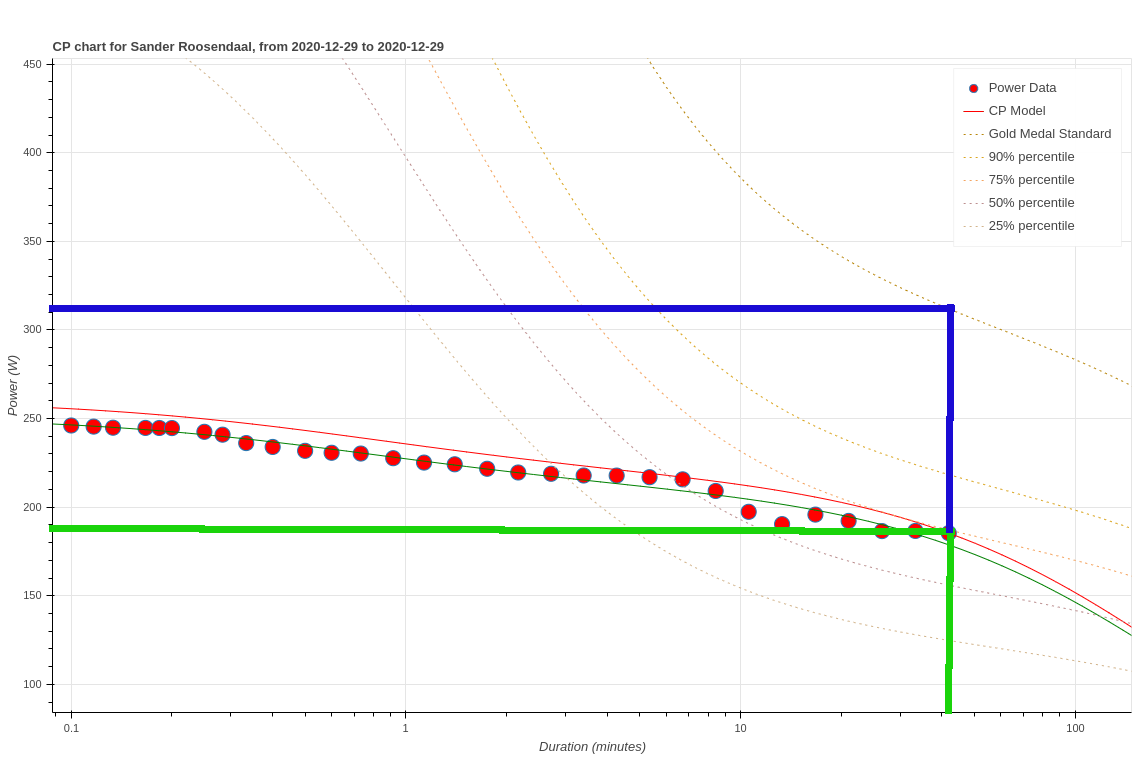 The chart shows how this works. Each rowing workout that you do is transformed into Critical Power data. The CP data are then compared to CP data for World Record holders in your age, gender and weight class group. Our algorithm finds your best performance relative to this Gold Medal standard for your workout. In the example in the figure, I was holding 185W over 41 minutes. The Gold Medal Standard for on-the-water rowing for 41 minutes is a whopping 312W. That makes my Gold Medal Score for that workout 59% (over 41 minutes).
Of course, not every workout is a record-breaking one. So that’s where the concept of Marker Workouts comes into play.
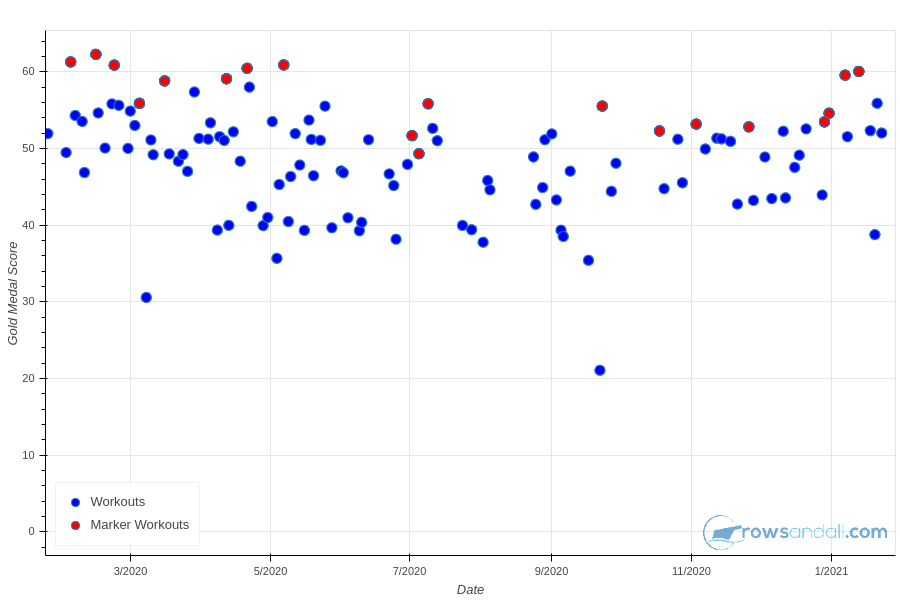
This chart shows the Gold Medal Score for all rowing workouts in the past 12 months. The red dots are the “Marker” workouts. These are all workouts that I have marked manually as such, plus workouts that were found automatically by the Rowsandall.com site. The algorithm is pretty good at finding workouts with hard efforts, both for indoor rowing as well as for outdoor rowing.
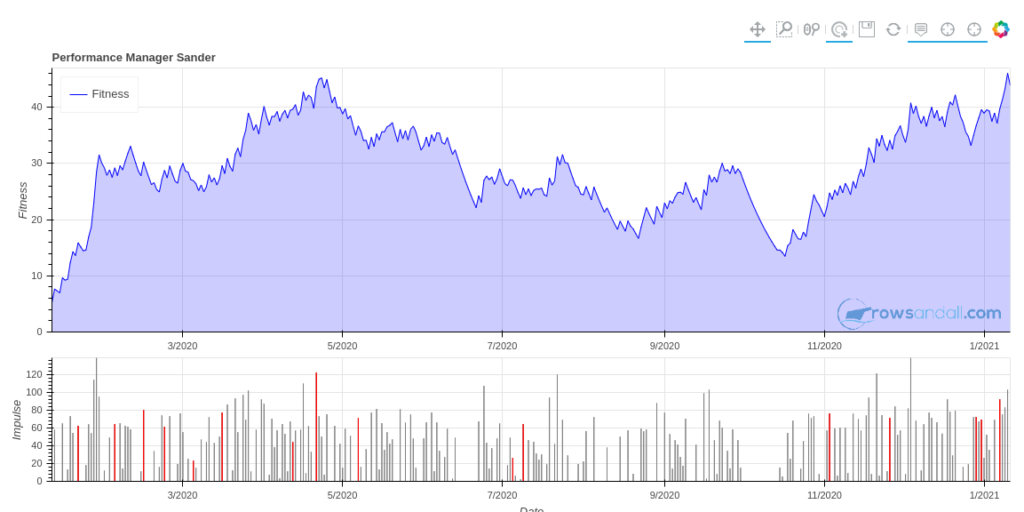
Looking from left to right, you can see that I was hovering around 60% at the end of last winter. Note that the marker workouts here are indoor rowing sessions. I was able to keep the performance up until about May, after which it dropped. Compare this with my Performance Management chart:
Do you see the pattern?
So, getting a Gold Medal Score of 60% is pretty sobering. It’s good to compare yourself with World Record holders, but it might be more relevant to know how you compare to the average club rower or indoor rowing enthusiast.
You can do this by looking at the dotted lines in the CP chart. These are percentile scores. So if you’re at a 75% percentile score, it means that you’re better than 75% of the rowing population (of your age, gender and weight class).
We believe that Gold Medal Scores are a valuable new metric to track for your trainings. In the end, we just want to point out that:
- You can see the Gold Medal Score also on the Workout Stats page
- On the CP chart and on the Marker Workouts chart, you can hover with your mouse over the data points to read the values. You can click on the blue and red dots and open a link to the workout that generated that score.

