
Video is a great tool to help improve your rowing. Being able to see what you are doing in the boat can help you isolate flaws in technique and can also help you see if the things you are trying to fix are getting better.
The same can be said about rowing data. By tracking your power, speed and other detailed data about your performance on the water or on the erg, you can spot problems, and track changes over time.
And these two different approaches can be used together for an even more powerful tool to enable you to coach yourself, or work with others to get better at rowing. Here’s an example of that from the 2017 head of the charles.
I combined video from a GoPro and data from the NK Speedcoach to see how things were going at the end of the race.
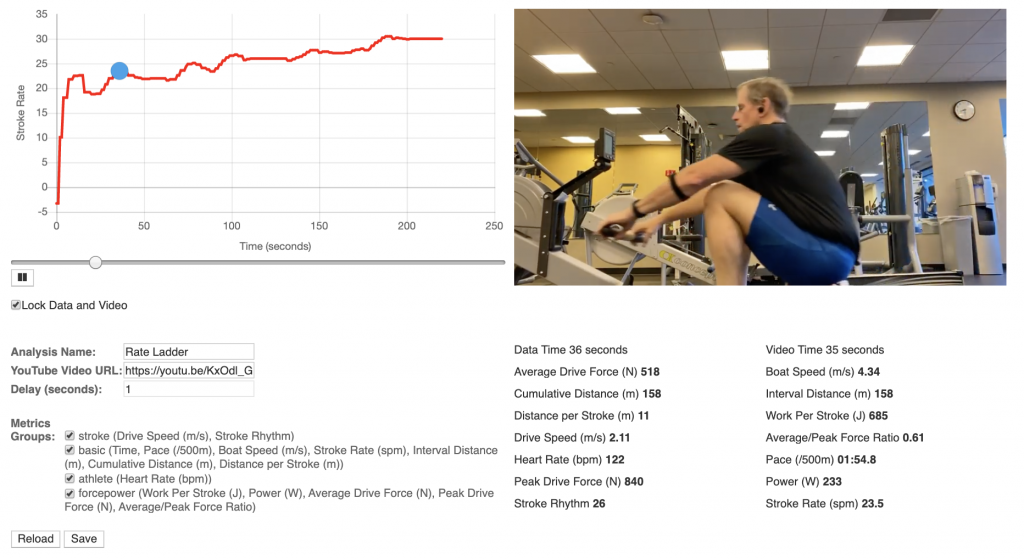
Combining data and video makes video so much more useful. You can see the stroke rate. You can see your level of fatigue (Heart Rate). You can see the exact pace and power that you are able to produce.
But, even though this can be a great tool, it is very rarely employed. Because doing it is really complicated.
My friend Sander wrote an article on how to use a tool called Dashware to combine video and data a couple of years ago. If you follow the link, you’ll see that it is pretty involved process. Once you’ve done it a few times, you get used to it, but it’s really tricky to get it right the first time. I think that 95% of all rowers would reject it as a waste of time.
I really wanted a much easier way to combine videos and rowing data. This started a conversation between me and Sander and search for the best way to get it done.
The first idea was to use youtube to host the videos. Youtube is the most common platform for people to share videos. The embedded player let’s you get to any point in the video quickly and you can alter the playback speed so you can look at technique in slow motion.
The second idea was to use rowsandall as the data platform. The site stores all the rowing data in a consistent way, and has the mechanisms to allow rowers to selectively or publically share data.
Sander spent some time experimenting and came up with a prototype. I was very excited. Even in it’s initial form, I could see the potential of the tool. It took less than 5 minutes, with no instructions for me to do my first video analysis.
Here’s a great example of an on the water video analysis. This specific video was taken when Sander was trying Randall Foils last season.
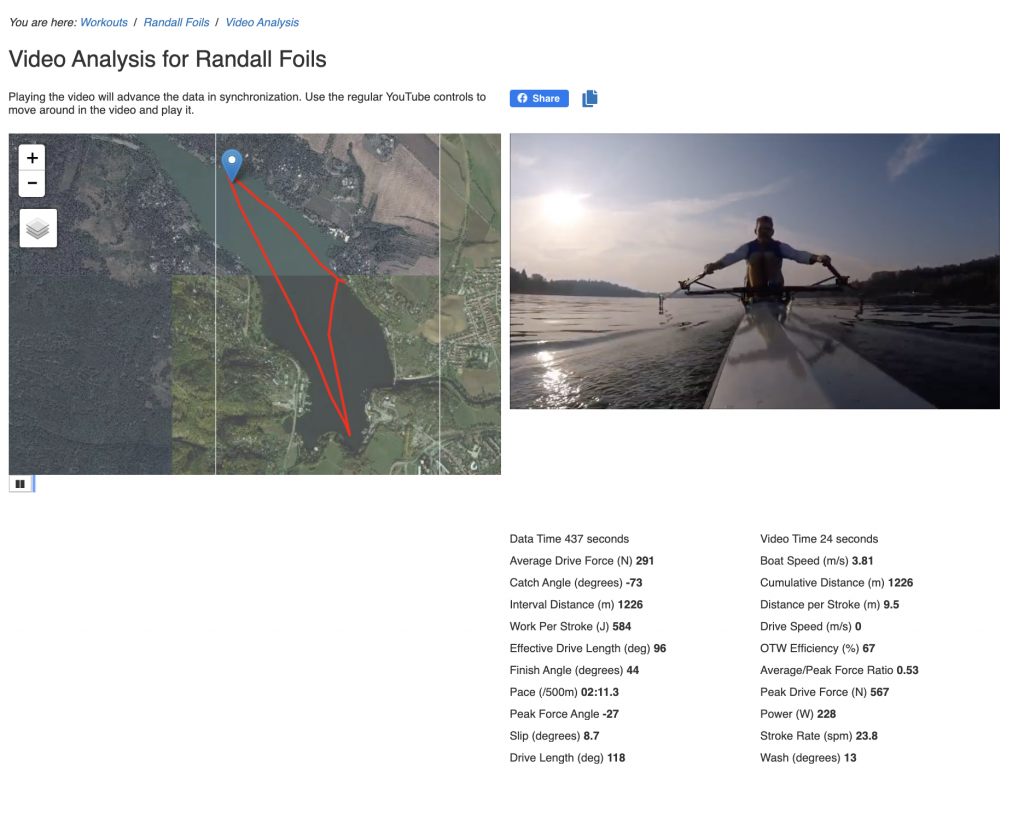
The map on the left is a live map. The dropped pin follows your position from the data and matches the location shown in the video. And all of the rowing data is shown below the video and updates, stroke by stroke as the video plays.
You can control the video playback using the embedded YouTube controls.
You can move the slider to get to a specific part (which shows up on the map pointer) and adjust playback speed to get insights about parts of each stroke.
It also works for erg videos. Like this one.
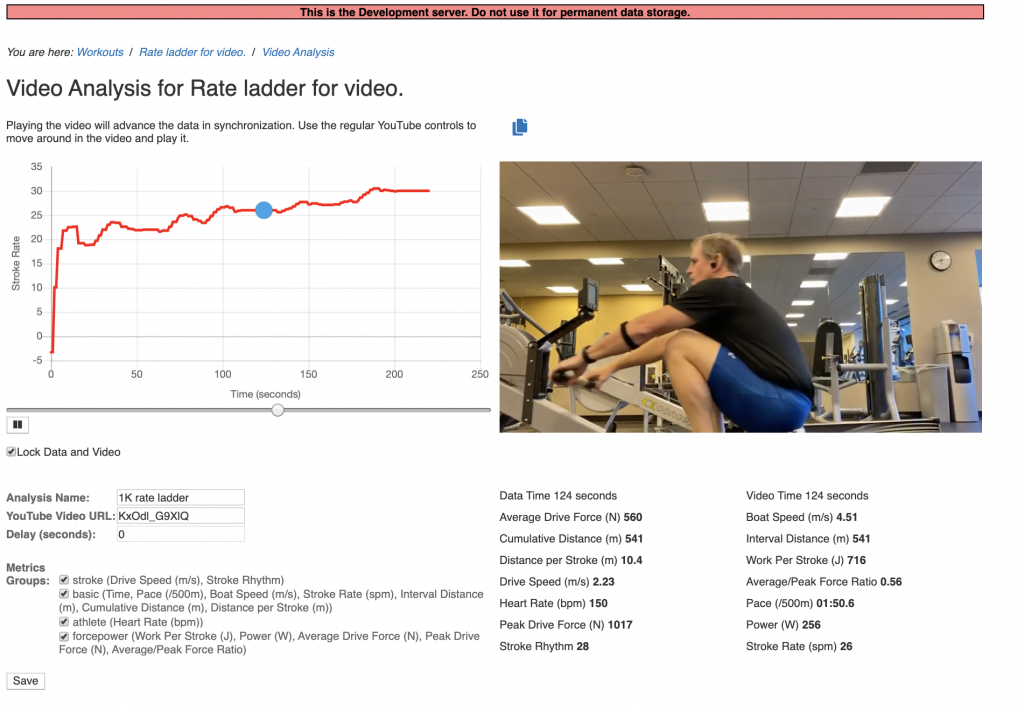
For ergs, instead of a map, you get a plot of the stroke rate for the whole row to help you find the right place for the video.
In our minds the key to making this useful was to make it easy. Really easy. Here’s the process.
- Upload your video to youtube
- Upload your data to rowsandall
- link them together
- line up the timing
- press play
That’s it.
Detailed Instructions:
- Upload your video to youtube.
To do this you need a youtube account. There are a lot of good tutorials about how to get started on youtube. Here’s a link to youtube help. When you upload the video, you need to set the access permissions to “public” or “unlisted”, so that rowsandall can access the video on your behalf. I can’t add much to that.
Once the video is uploaded, copy a link to the video to the clipboard. - Upload your data to rowsandall.
To do this you need a rowsandall account. There is a good article about getting started if you are an indoor rower at this link. There’s a getting started article if you are rowing on the water here.
One thing to note…Video Analysis is a “Pro” feature on rowsandall, so you need to be a subscriber to use it. You can find out more details about what you get for a pro subscription and current subscription rates here. - Link them together.
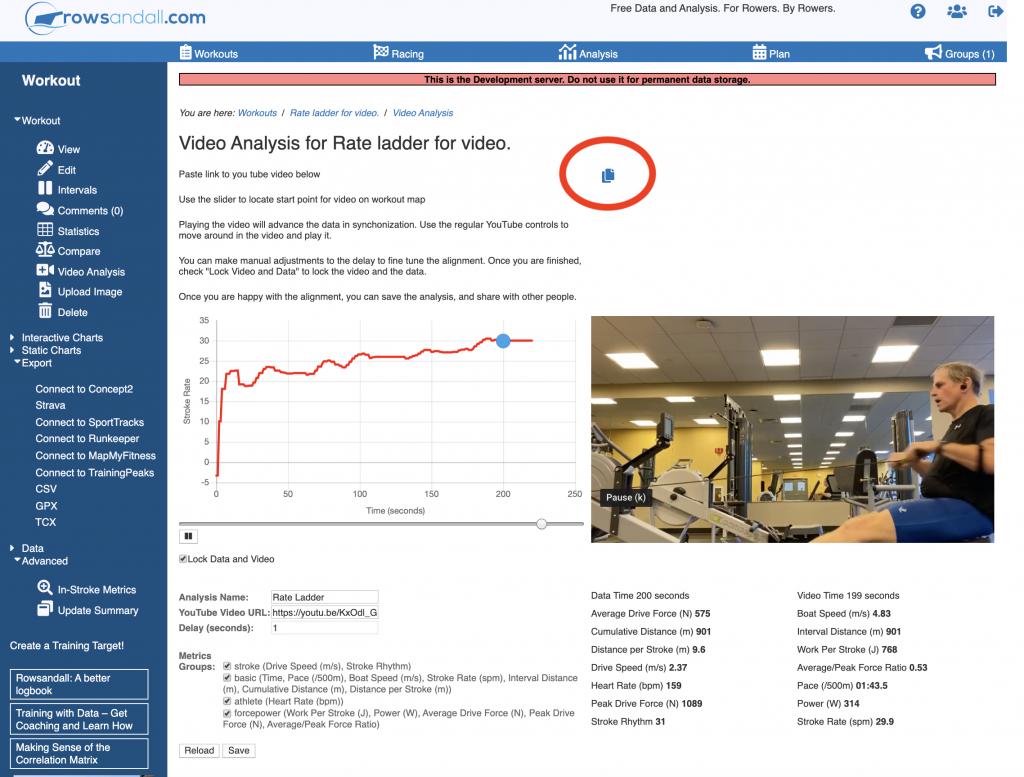
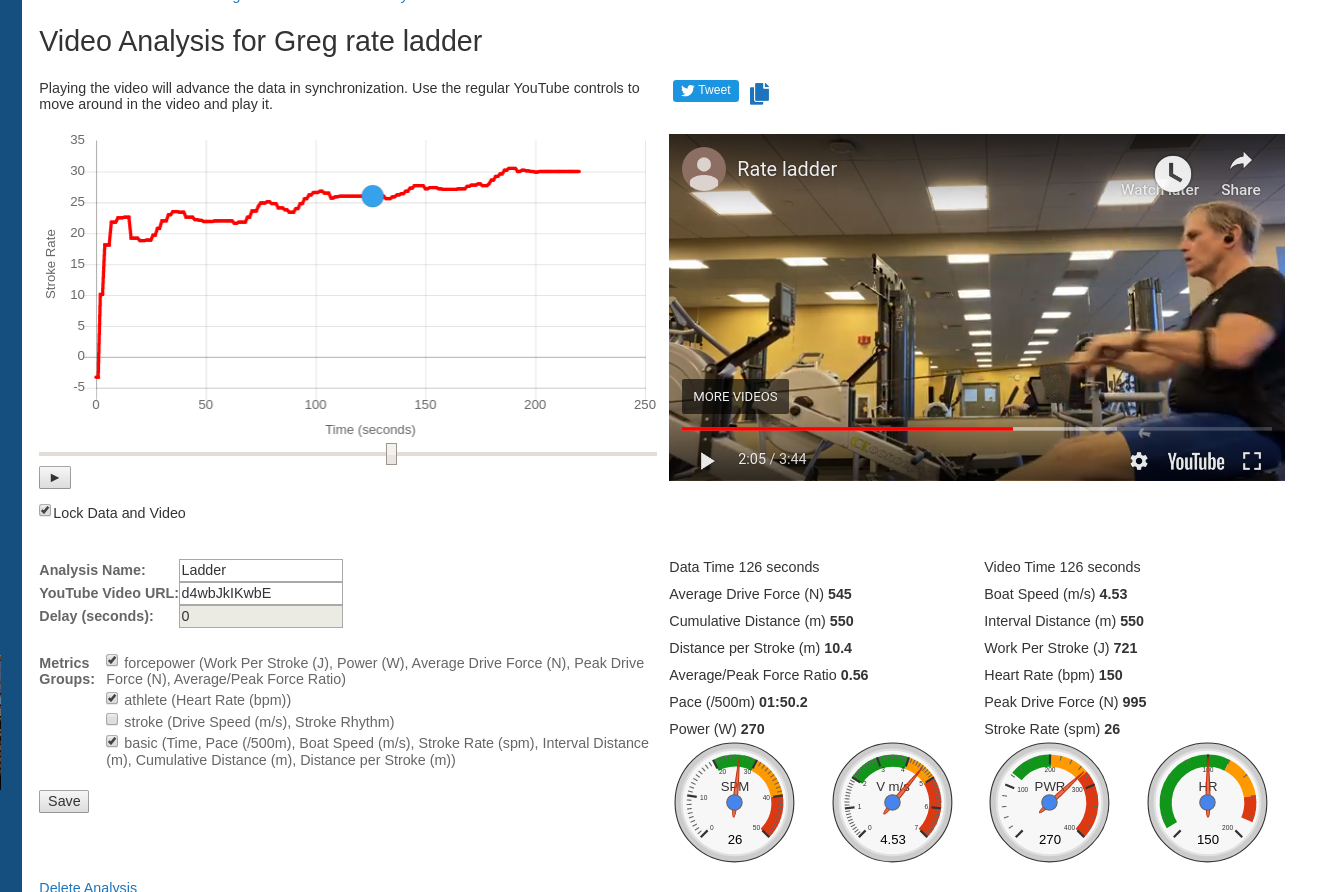
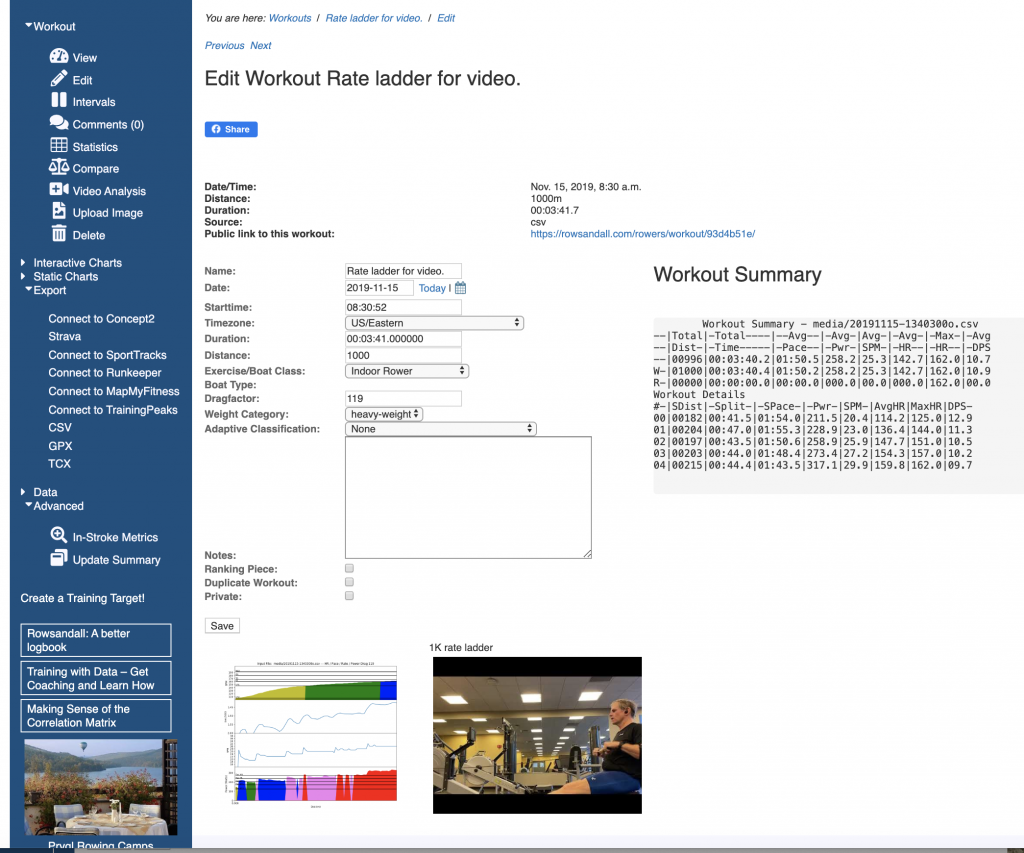
On the workout edit page, there is a new command on the left side menu, called (appropriately) Video Analysis.

If you click that, you get to the Video Analysis page.
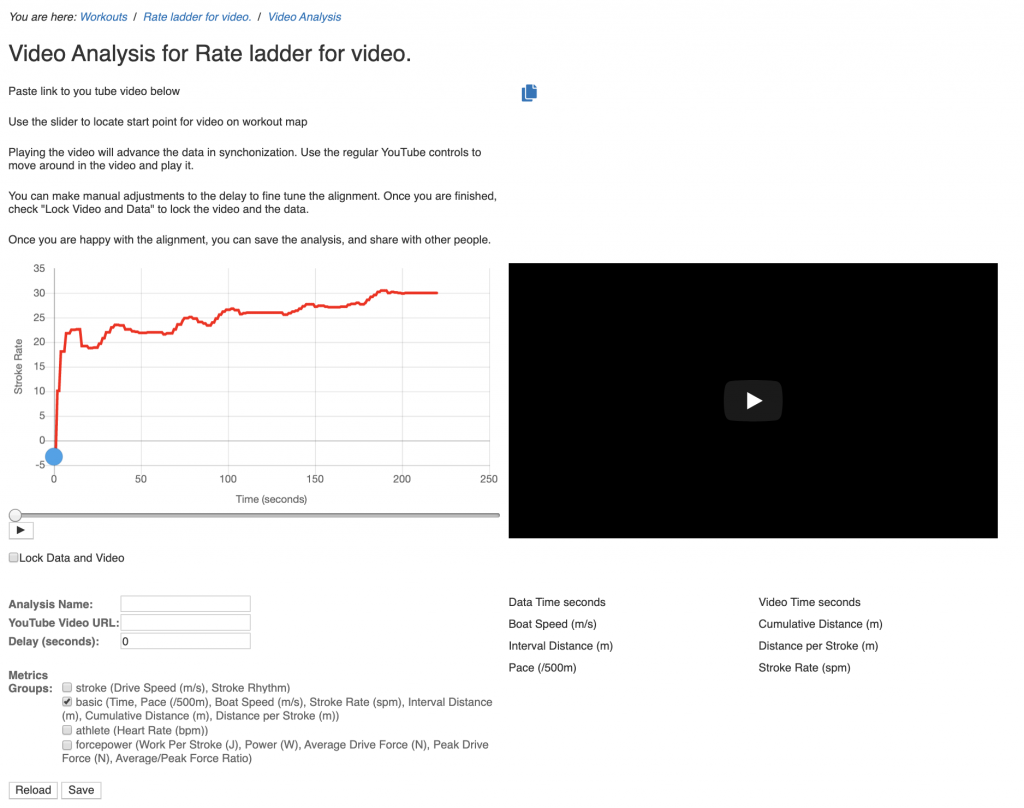
This is where the magic happens!
3a: Paste the link into “YouTube Video URL:” field.
3b: Decide what data you want to look at by checking the boxes under the “Metric Groups” label.
3c. press reload. This sets up the viewer with your video so you can do the alignment.
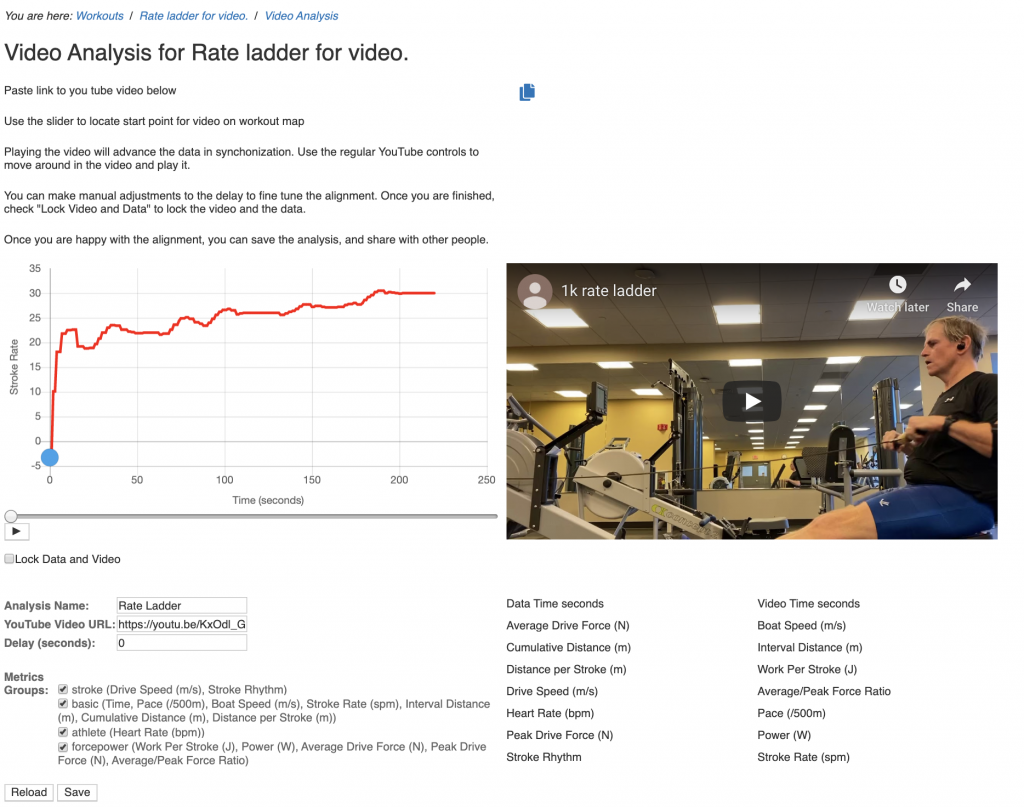
- Align the video with the data.
You can align the data and video by moving the slider on the bottom of the stroke rate plot to where the video starts, or by using the slider in the youtube video to a known point on the stroke rate graph. It doesn’t have to be perfect since the data is updated once per stroke. You only need to get within a couple of seconds.
Once you are happy with the alignment, you click the “Lock Data and Video” box and from then on, the controls are linked. If you slide the SPM slider, the video will move. If you slide the video controls, the data will move.
When you are happy with the video, save the analysis by using the “save” button. Then you can click the button at the top of page to get a shareable link, so that you can post your analysis to facebook, twitter, or send it by email to your coach for feedback.
This is just the beginning of Video Analysis for rowsandall. We are in the process of designing gauges to provide visual feedback and will be updating the analysis page with them as they are finished. Ultimately, it will be possible to extend this feature all the way to include detailed within stroke metrics like force curves and oar angles, but that is way off. Here’s a sneak peak at some of the basic gauges we’ll be releasing soon.
The other thing that is great about using doing video analysis on rowsandall: You can find the analysis later. After you do the analysis, it stays with your workout entry.
I’m really excited about the potential to use video as a more regular part of my training process next season. I think the new capabilities in rowsandall will help make it easy, fast and practical.
Try it out. I think you’ll like it. And we’d love to hear your ideas about how to make it better.