
On rowsandall.com, you can look at statistics per workout and statistics collected over a number of workouts. This can be quite interesting as it gets you some insights about your rowing.
I will try to explain using my own rowing as an example:
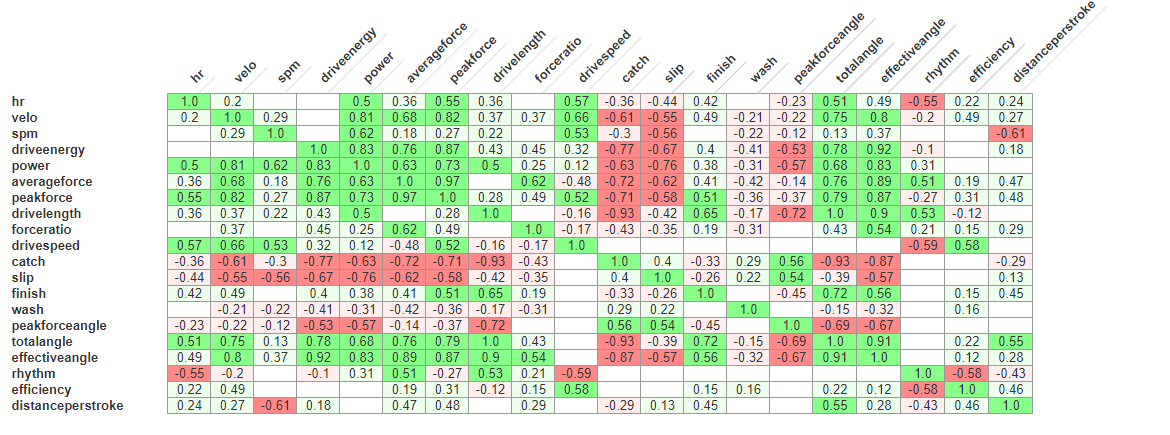 So in this chart, green indicates a positive correlation, and red a negative correlation, with the lighter colors being a weak correlation and the darker colors being a strong correlation. The number given is the Spearman Rank Correlation Coefficient. Taking some of the illustrations from the Wikipedia article, this is a positive correlation:

When X increases, Y also increases. This is a negative correlation:

When the quantity X increases, Y decreases.
So, back to my correlation matrix. The strongest positive correlation (0.92) is found between effectiveangle and driveenergy (that is work per stroke, I will have to change the site to list the verbose name, not the column header).
This correlation makes sense. The effective angle (effective drive length), measured by the Empower Oarlock, is the arc over which your force is higher than 100N. The work per stroke is a function of both the average force and the drive length.
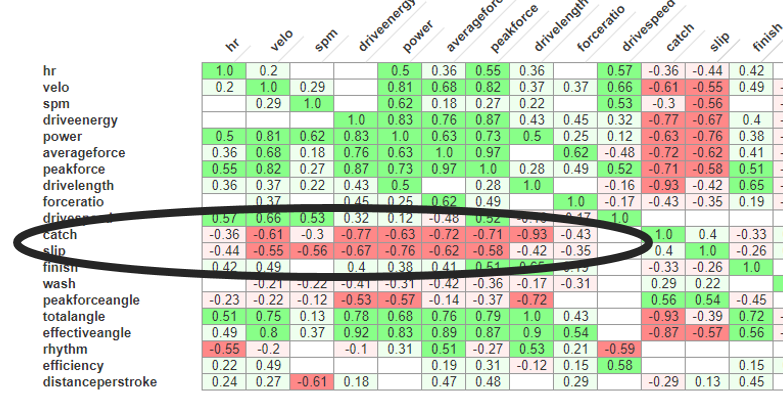
It starts to become interesting when we look at some of the strong negative correlations:
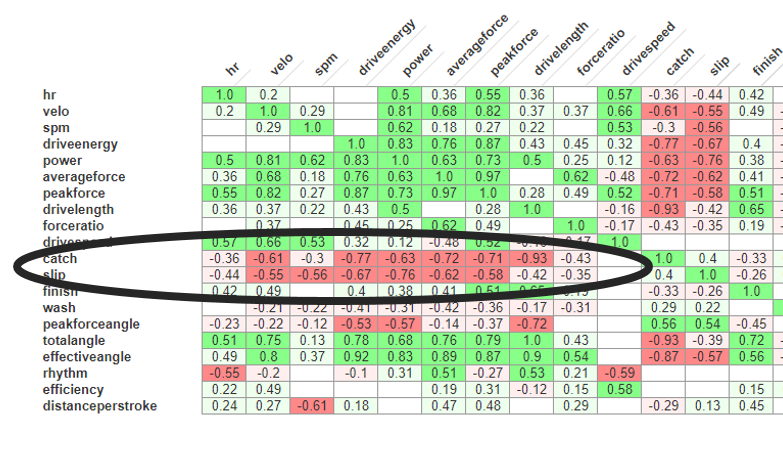
Here, we have to understand that the Catch angle as measured by the Empower Oarlock is a negative value. So the greater the negative value of catch angle, the higher velo (boat speed), work per stroke, average force, peak force and drive length. And what is really interesting is that the correlations are much stronger than for finish angle. It seems to suggest that boat speed is to be gained from the catch, at least in my case.
The question is of course what is the cause and what is the effect? Do I reach to a longer catch angle when rowing at race pace? That might be true, but the correlation coefficient for boat speed is bigger than that for stroke rate. It is clear that drive length is a strong factor in boat speed (and boat efficiency).
The other parameter that has a strong correlation is slip. Slip is a measure of how steep your force curve is around the catch. A larger value of slip is a less steep force curve. So the strong negative correlations with boat speed, etc, mean that, for my rowing, a fast and strong catch makes me faster. Or does faster rowing make me pick up the force faster around the catch?
It’s important to always think about cause and effect. The correlation matrix gives you stuff to think about, but you have to make the link to your rowing yourself. Still, with all those caveats, I think it makes sense to take a look at these correlations regularly.