
This is the third article in a series of 3. The first article focuses on the boats, location and equipment. The second article focuses on improving the drive and recovery to avoid boat checking. This third article shows how we analyzed and improved catch angle and drive length
Catch Angle
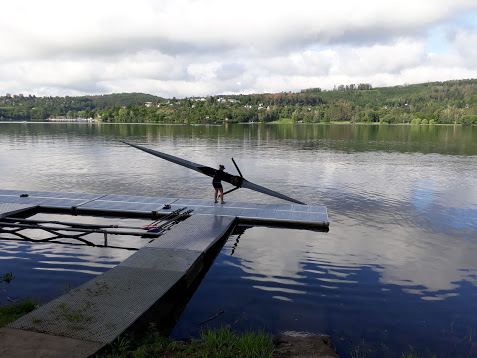
Our next rower. Let’s call her Helen. She’s a very good sculler. Her blade placement is exemplary. She has a smooth stroke and good boat handling.
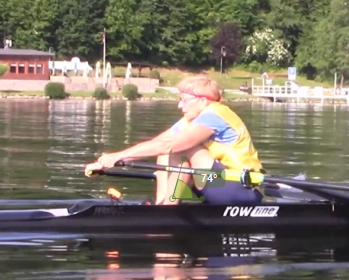 We identified two points for Helen to work on. The first one is something that we currently don’t have sensors for. You can see it from the picture though. She has to relax the shoulders a bit around the catch.
The second point is about catch angle. As you can see in the still, her shins are not perpendicular to the boat. (This picture was taken on day three, when she already improved a lot, compared to day 1.) She can actually reach a bit further, and the thing that is holding her back is insecurity.
The tool we used was simply to install an Empower Oarlock and set the SpeedCoach to show catch angle. Helen would monitor the numbers and it would give her a target to work to, and motivation to try and improve the numbers. It’s extremely simple, but being able to see how far you are catching and pushing yourself to go further in small steps really helps. So this is a technique improvement where the Empower Oarlock really shines.
Comparing Rowers
Rowers come in different sizes, ages and ability levels, and we were conscious of that when we were comparing numbers. With that disclaimer out of the way, there is a lot of value in just looking at numbers side by side and discussing why there are differences. We’ll focus on drive length, as it is one of the primary drivers of boat speed. We’ll also look at catch and finish angle, as it is something that is easily adjusted.
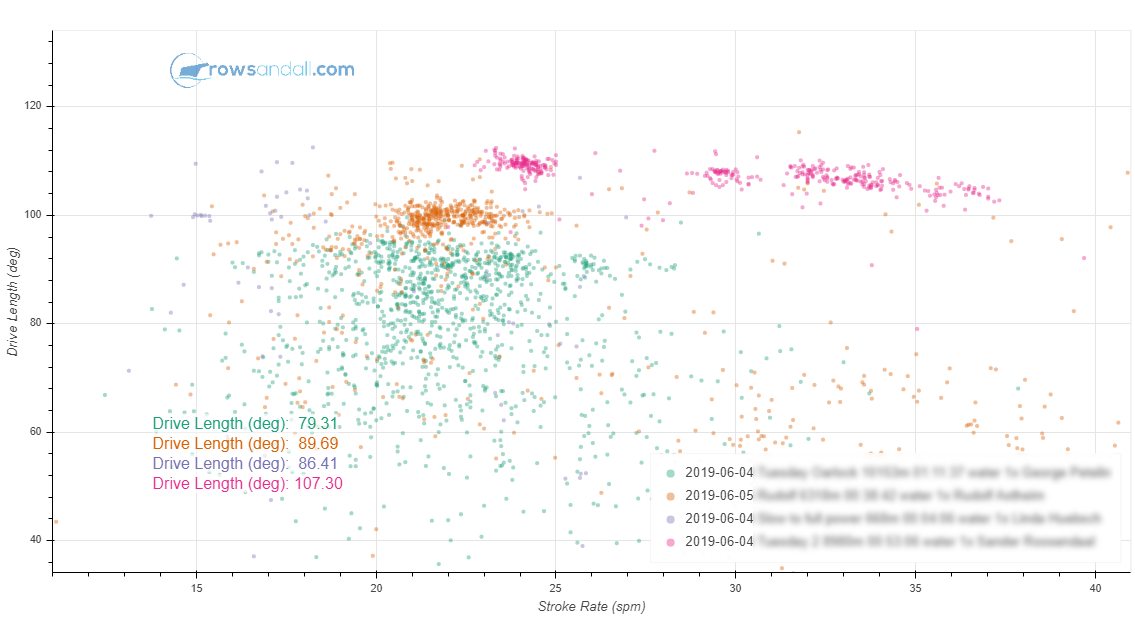 In the chart above, we are looking at drive length across stroke rates for four of our participants. We can see a couple of things. Mr Purple has the longest drive length, and it is pretty constant across the stroke rates sampled. Mr Orange follows. He is a bit shorter than Mr Purple. Green and blue are very inconsistent.
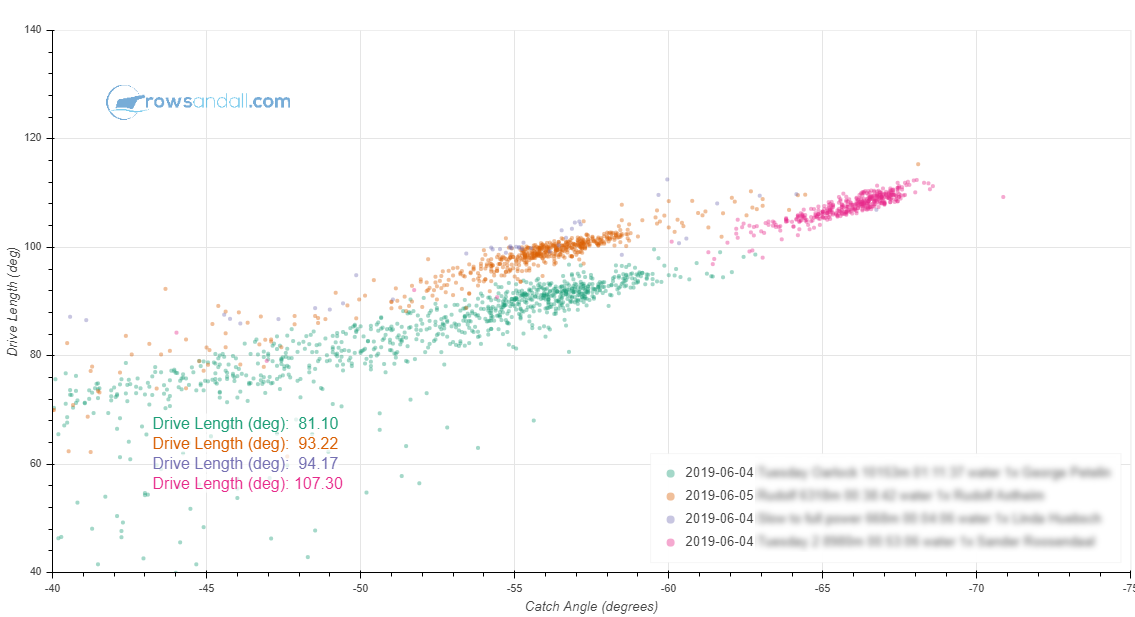 The next chart shows drive length and catch angle. The two metrics are strongly correlated of course, but you can see that Mr Orange is on a different curve than Mr Green and Mr Purple. This is related to footstretcher position, which we did end up changing a bit for Mr Orange.
 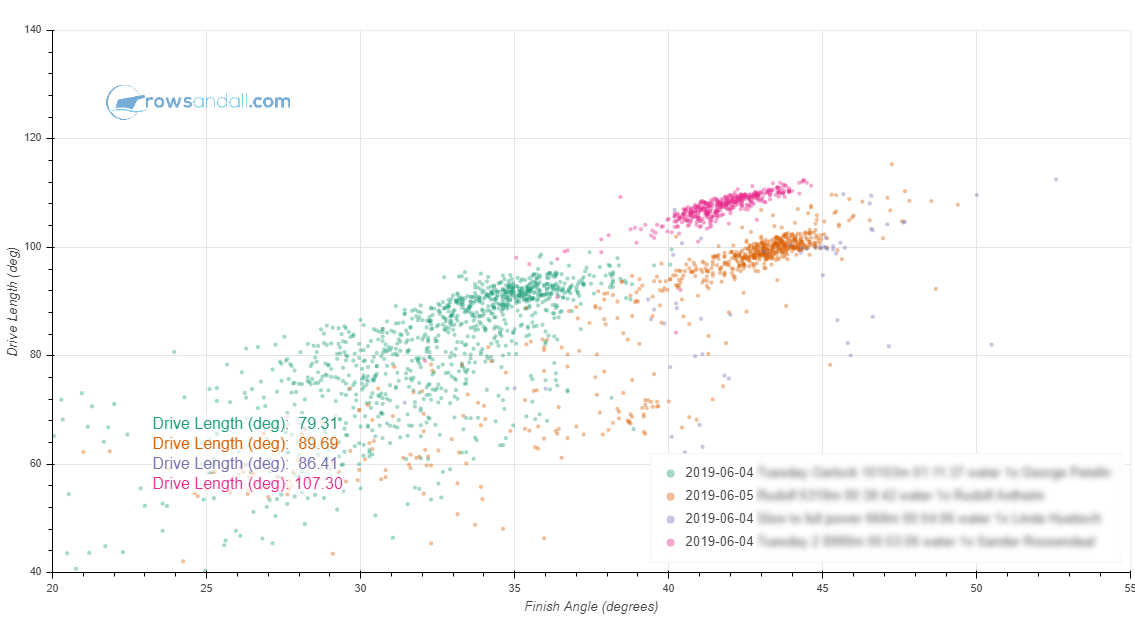 The same set of data, but now looking at finish angle. Mr Green is short, but he is on the same curve as Mr Purple. Mr Orange has a different footstretcher setting.
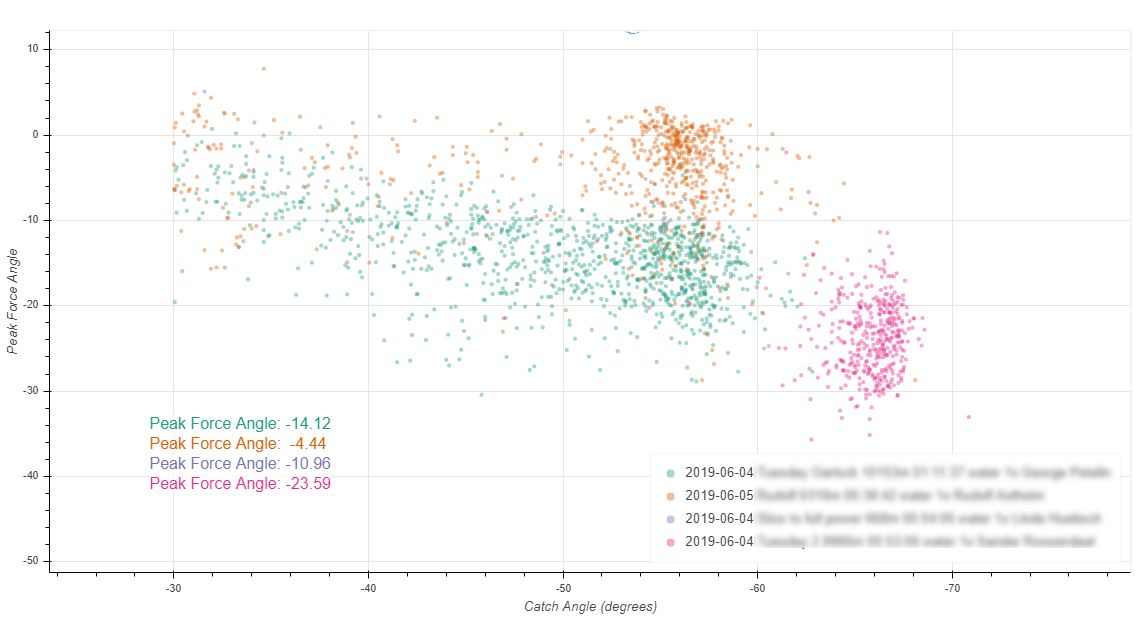 A third view on the same data set. Now we’re looking at the peak force angle, which we ended up moving a bit more in front of the pin after analyzing these data.
At the camp, we also went through some other metrics. Comparing rowers and discussing the values of different metrics is a great way to add some facts to your thinking about your boat setup. It forces you to articulate why you made certain choices, and opens your mind for the possibility to change.
Just knowing what the value is of the catch angle, how consistent it is, and how much you can improve can be enough to point a rower in the right direction and get them to improve.
Conclusion
This is the final article about the rowing camp. We have done much more than can be described in three short articles, but I hope you get the idea of how much can be achieved. In a relatively short time, we were able to get people comfortable using the rowing data and making real progress.
For me personally, there were a few important things I took out of the camp:
- It is really fulfilling to see each of the participants and help them improve their rowing by selecting the sensor that gives them just the right information
- Working with people who are new to rowing data. You need to take the time to set up their boat and get them up to speed on using the app or device during the row, getting the data off the device, and analyzing the data. We did have some user registration hiccups unfortunately. Also, the current apps and devices aren’t really “set-and-forget”.
- I was amazed by how effective the video and data combination was. It worked two ways. Initially, we looked at technique flaws to work on and then showed the participants which metric they had to improve. But in the other direction, the data gave us indications on what part of the stroke to look at, and then we had slow motion video to analyze. This could be even more effective in the future if there was an easy way to get time stamped data aligned with the video in a fully automated way. Merging the data and video streams between the row and the video analysis wasn’t practically possible today. But if there was a way to automate that and look at the video annotated with the data, that would be hugely effective.
The camp participants should all be proud of what they achieved. They all worked very hard. Here’s what I think is most valuable for this group:
- Thorough review of their boat rig, based on their stroke, body size, strength
- World class coaching for multiple sessions per day – something that Masters rowers rarely get.
- Learning how to use data to work on technique
- Learning how to use data to track your training and progress against the plan
Any technique change takes tens of thousands of strokes to really settle in, but the first few thousand strokes were done during the camp and I am happy to say that the participants were very focused, and managed to make some real improvements.
On top of that, we made new friends, had a lot of fun together and enjoyed beautiful weather, good food, Czech beer and Moravian wines.