
This is the second article in a series of 3. The first article focuses on the boats, location and equipment. This second article focuses on improving the drive and recovery to avoid boat checking. The third article shows how we analyzed and improved catch angle and drive length
Drive and Recovery, and Boat Checking
Robbie Manson calls it “hang and bang“:
“You want to put the blade in the water at the catch, relax and hang off it with as little tension as possible. Then you want to swing through the middle. You want to produce your power through the middle of the stroke, not at the catch.
The opposite being the bang and hang which only leads to a slower boat. You don’t want to bang otherwise you can’t hang. Banging means hitting the catch too hard or tensing or jamming it off the front.”
Here is one of our participants, let’s call him Bob:
This video was taken on the third day. Bob is an experienced sculler, but hadn’t had the opportunity to scull in more than a year. It’s remarkable how quickly he recovered his technique, he made great progress during the week. On the first day, we pointed out that he was “skying” in blades on recovery and missing water at the catch. By the third day, he had made fantastic improvements.
When Bob didn’t have access to water, he spent a lot of time on the bike. Over that time, his legs got a lot stronger and his core and upper body didn’t. Our coach Adam felt that improvement in Bob’s core strength could help him unlock a lot of speed. In the gym, we demonstrated a strength program that should help him develop a lot more “boat send” in the second half of the drive.
The other thing that is slowing Bob down is boat stopping around the catch. He bangs, then hangs, to speak with Robbie Manson.
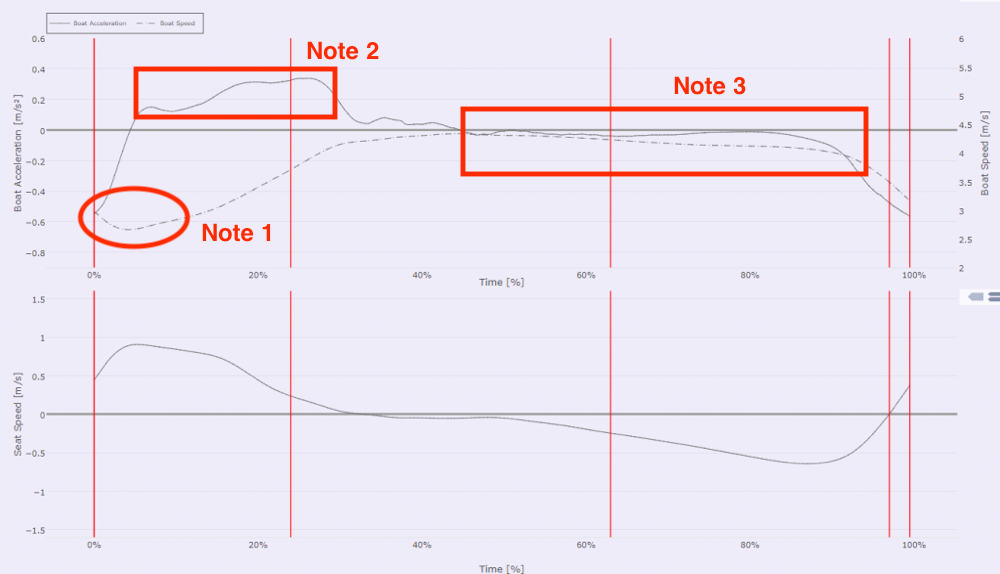
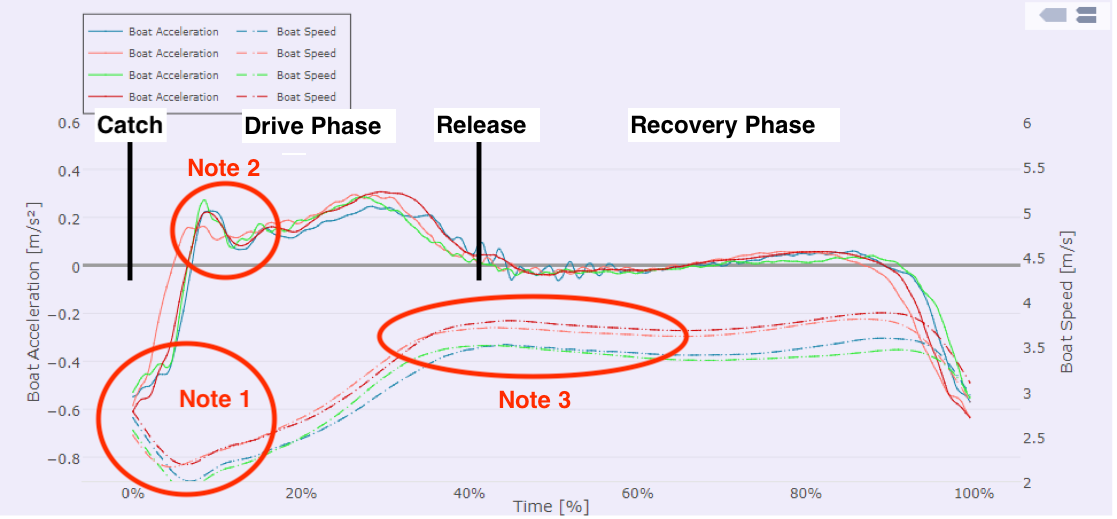 The charts shows boat acceleration (solid lines) and boat velocity (dashed lines) for four different outings. All four measurements were at 22 spm. The catch is at the left edge of the chart. We’re looking at boat acceleration. Here are a couple of points:
- Notice the plateau at the base of the acceleration curve at the catch, and the deep dip in the boat velocity (dashed lines). This shows that the boat is stopping at the catch. You can also see it in the video. Bob slams into the front stops and pushes his legs pretty hard, but it’s not picking up the boat speed in the first part of the drive
- Boat acceleration drops after the first peak (legs) and drops dramatically after the back swing is finished
- Boat is slowing down during the first part of the recovery.
he Quiske app enabled us to compare how rowers with different techniques drove the boat acceleration and velocity through the stroke.
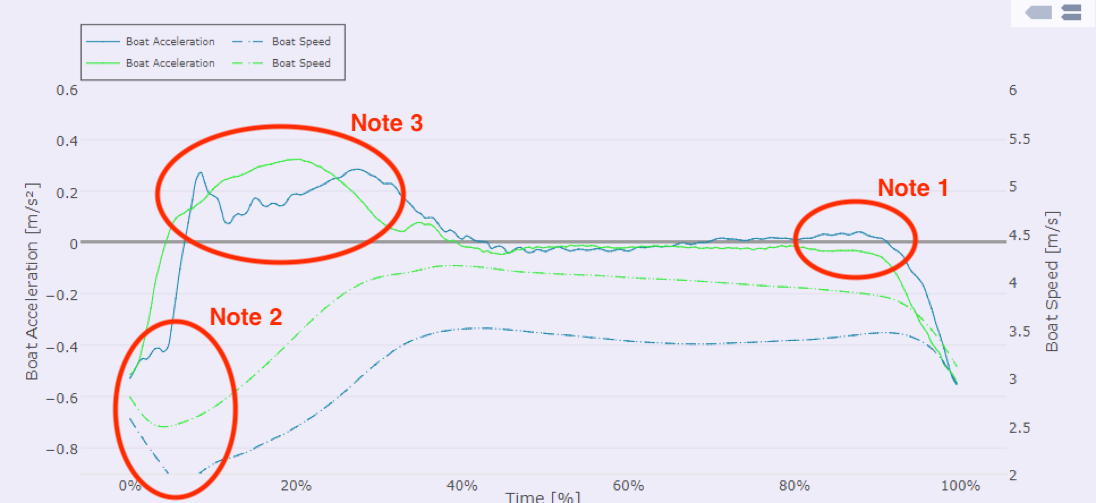
Bob (blue) and Alex (green), are rowing at the same stroke rate.
- On the recovery, Bob starts accelerating the boat just before the catch, which you can see as the hump in the acceleration curve at the right side.
- At the catch, Alex is losing much less speed. Notice how deep the dip in Bob’s boat velocity is compared to Alex. Also note the plateau at the beginning of the drive showing that Bob was missing some water before he makes the catch and picks up the boat. (This effect is less pronounced on the video which was taken on the third day of the camp after Bob had made some great improvements.)
- Alex boat speed is higher, so the drive phase is a bit shorter than Bob’s. But you can see the gradual build of the acceleration through the drive, versus the double hump in Bob’s. This illustrates the difference between “Hang and Bang” (Alex) and “Bang and Hang” (Bob)

The Quiske app and RowP pod enabled us to also understand and work on the how our rowers were controlling their oars during both the drive and recovery phase of the stroke. There are a couple of important things that we were able to see from this view.
- Alex blade curve (green) vs Bob’s (blue). Alex sweeps through a angle of about 95 degrees. Bob sweeps through about 85 degrees. That is basically because Alex is 186 cm (6’1″) tall and has a longer stroke than Bob at 164 cm (5’4″). That may be a simple reason for the difference in boat speed.
- You can see that the height of Bob’s oars is increasing as he approaches the catch, where Alex is able to maintain a much flatter approach to the catch. This is the oar angle view of “skying” and usually means that the rower is skimming his blades on the water, and then lifting them off to square them before the catch. This contributes to missing water.
 This chart is one of oar angle speed, again comparing Bob in blue with Alex in green. Two points:
- The blue line starts at negative angular speed (handle still moving towards the stern) while the green line starts at positive angular speed (handle moving away from the stern). The time=0 point in Quiske charts are determined by the point of lowest boat acceleration (or largest boat stopping). For Bob, this moment is happening before the handle direction is reversed, while he is slamming into the front stops, and it takes some time after the handle has reversed before he is starting to accelerate the boat. For Alex it’s the other way round. I am not saying that Alex is the ideal rower (far from that), but Bob surely could gain a lot from being more efficient in the part of the recovery just before the catch.
- In the second half of the recovery, starting at 80% of the total stroke time, Bob’s blade angle starts to accelerate into the catch.
The interesting thing here is that these points were hard to spot on the video, but once we had looked at the data, we were able to spot it by looking at Bob row. By using video, data feedback and live coaching, Bob was able to see and understand the specific elements of his stroke that could be improved.
During the camp, Bob focused on:
- Eliminating boat stopping body movements during the recovery, especially just before the catch.
- Picking up the boat a bit more subtly and changing his drive profile
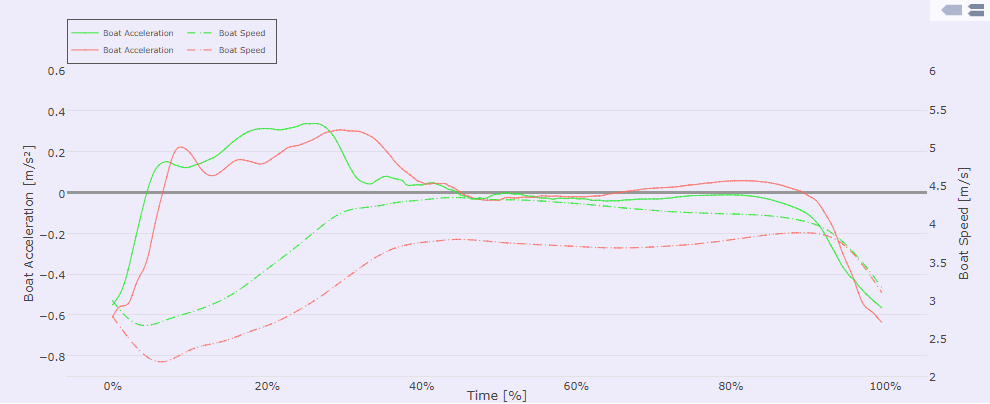
 Back to the boat acceleration and boat speed curves. The red curve was measured later in the week. Bob managed to change the profile and his boat speed increased, in identical (wind still) circumstances.
Notice that there is a much smaller plateau in the acceleration curve at the catch and the depth of the velocity dip is smaller. Also notice that he has started to minimize the initial peak in the acceleration curve, which means he was applying his leg power more smoothly in the drive. He still has work to do to improve his approach to the catch during recovery, because the acceleration still shows a hump at the right edge. But using the Quiske pod and app we were able to detect the effect, break it down into what’s causing it, and give him a tool to monitor it during subsequent outings.
Case Study 2:
Here is a second case study from the camp. Let’s call him Arnold. The video was taken on the last day of the camp, and by then he had made some significant improvements.
Arnold has a smooth catch. Very smooth. Arnold hangs, but there isn’t much bang. That was his first priority in camp.
The second thing Arnold was working on was a strong position at the finish. He tends to look into the boat, and could lay back a bit more, especially with his upper back, lower back angle looks okay. Basically, he wanted to have a stronger second half of the drive, combined with a more dynamic recovery.
In Bob’s case, some of the improvements in technique require work in the gym to help his core and upper body “catch up” with his strong legs. In Arnold’s case, his leg strength, core and upper body are pretty well matched and the recommended changes to Arnold’s technique could be tried right away during camp. Making sure that the new habits stick will be a matter of monitoring.
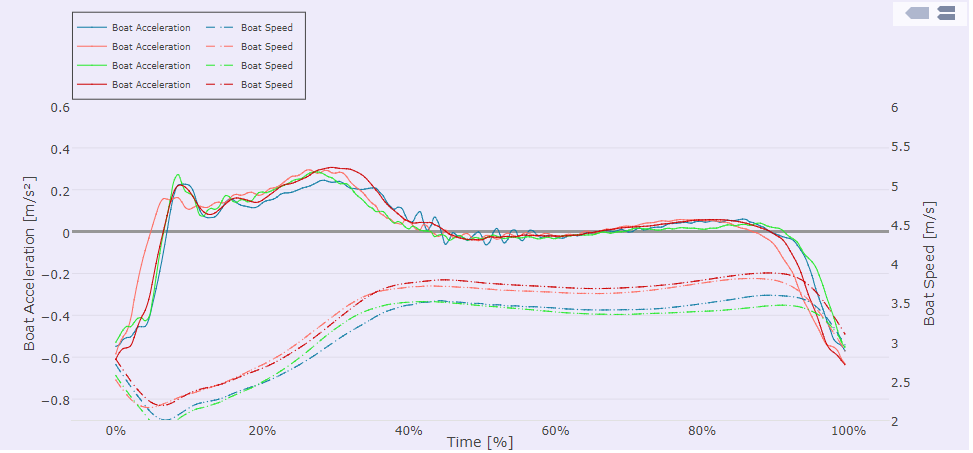
 The chart above shows Arnold’s boat acceleration, boat speed, and seat speed at 24 strokes per minute. Again, the catch is at the left edge of the plot.
- You can see that the boat loses very little velocity at the catch. (The depth of the velocity curve is very shallow). That corresponds to Arnold’s smooth catches.
- We were working on how to try to get more energy into the drive phase. Essentially this would fill in the dip of the acceleration curve.
- You can see how little Arnold disturbs the boat run during the recovery. The velocity slowly trickles down and there is almost no bumps in the acceleration curve. This means that Arnold seat speed during recovery is very well controlled.
Arnold stroke looks pretty good, let’s directly compare it to Bob at the same stroke rate:
Arnold gets good blade placement at the catch and quickly starts to accelerate the boat. Bob misses some water, so the boat velocity dips lower, and starts to climb later in the drive. In the recovery, you can see Bob accelerating in the second half of the recovery. So, even though both rowers reached almost exactly the same peak acceleration, Arnold is going faster.
Now let’s compare Arnold and Alex rowing a 500m piece at full power and race rate, side by side during the last day of camp. They were well matched in boat speed. Using Quiske, we can compare their technique under race conditions.
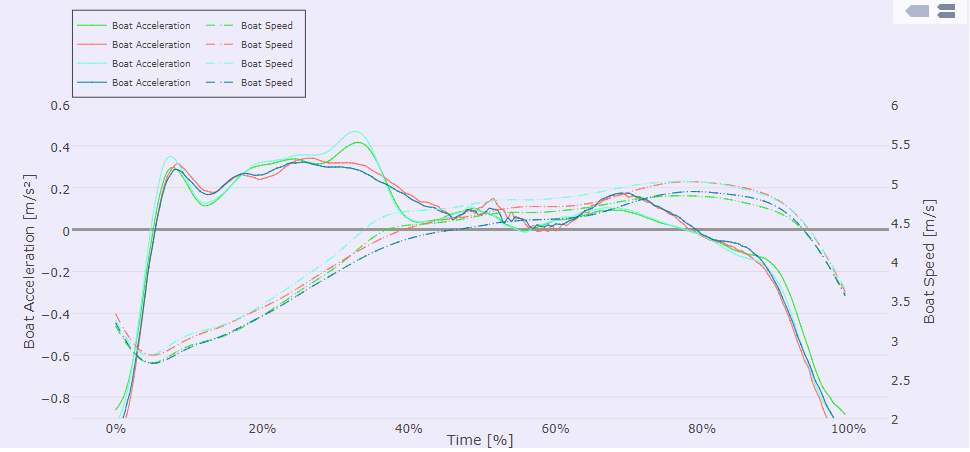
Alex is the blue and red traces. Arnold is the green and cyan traces. At 30 SPM, you would expect that to see more of a dip after the initial leg drive, and more of an acceleration at the end of the recovery and both rowers show that. But you can also see some interesting differences.
- You can see that Alex drive phase is longer than Arnold’s. That’s because Alex has a larger sweep angle. Arnold is now building power through and achieves a higher peak acceleration. These two rowers are are achieving the same boat speed through techniques that are matched to their strengths.
- One effect of Alex’s longer drive is that he has less time for the recovery than Arnold. Therefore, he is accelerating the boat a bit more during the recovery.
After the row, we compared EmPower data between Alex and Arnold and during this piece they were generating almost identical power. Arnold made great improvements over the duration of the camp and the proof is in the data.
Conclusion
This article showed how we used the Quiske app and RowP pod to look at the details of stroke dynamics for three different rowers. Using Quiske helped us discover an aspect of Bob’s rowing that we missed on the water and even later, looking at the video, but once we had identified it we went back to video and data to work on it. From data to insight in one morning!
Arnold’s data shows great evidence of the improvement. Inspecting a video stream is always a little subjective, but having having the tools to see a great build of acceleration at 30 SPM showed that Arnold had quickly mastered his improved stroke. Seeing the data was a great motivation.
We are organizing a similar camp in September, and we still have place for a few more rowers. Check the details on https://pryglrowing.com