This is the first article in a series of 3. This article focuses on the boats, location and equipment. The second article focuses on improving the drive and recovery to avoid boat checking. The third article shows how we analyzed and improved catch angle and drive length
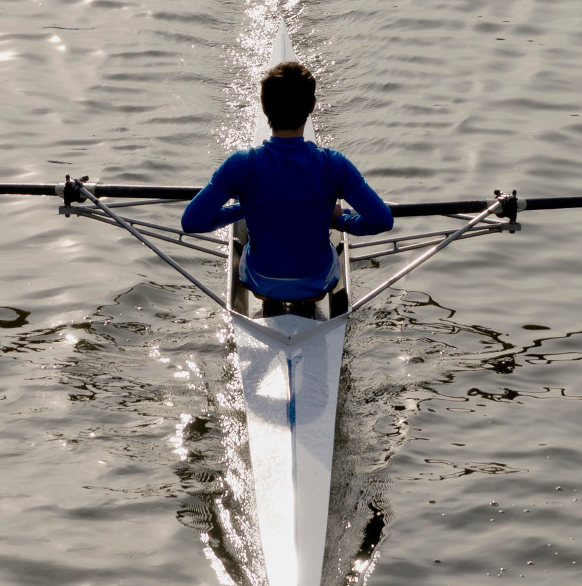
From June 2 to June 7, Brno, Czech Republic was again the center of the rowing data world. Collecting and looking at rowing data is nice, and satisfying for data geeks. Most rowers, however, only start to get interested when you show how they can use the data to improve their rowing. This is exactly what we aim to do on our rowing camps. During the week, we have a World Class coach analyze the participants’ rowing technique, collect data and take video of their stroke, and discuss the relation between the two. At the end of the camp, they take home tools to work on technique and boat speed improvements without needing a coach supervising each session.
You can only work on improving boat speed if the boat is rigged to get the maximum out of the rower. So, on the first day we kept the analysis to visual (inspection by our coach), feel (rowers’ feedback about how comfortable the boat feels) and (slow motion) video analysis.
It takes an entire day and three sessions on the water to work towards the ideal boat rig. For the rented boats, we start of with a standard rig. The participants who brought their own boats started with their normal setting.
 We let them row and take video. Then, together with the participant, we discuss how changes in the rig can help them work on their technique flaws and get better boat speed. Some of these were hypotheses, and we had to try them out. Some suggestions were radical, and participants were uncomfortable rowing their new setup, leading to another round of adjustments. During the week, we kept making small changes, and we did get our participants to think about doing more radical changes in the future. Although we didn’t collect any data, this was a very important day.
Choosing the right sensor
Another thing that I have learned through working with people who are new to rowing data is that you cannot just equip someone with lots of sensors and expect them to make sense of it. Even for people who were already knowledgeable with data, we didn’t want them to be looking at their little screens during the entire row.
So we were careful to pick one sensor and one metric to focus on for each of the participants.
Also, there were technique flaws that can be spotted easily by a sensor that every participant brought to the camp: the human eye: If you are working on getting rid of catching with bent arms, you don’t need a sensor to sort the good strokes from the bad ones.
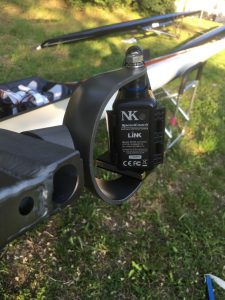
During the camp, we had two types of devices at our disposal: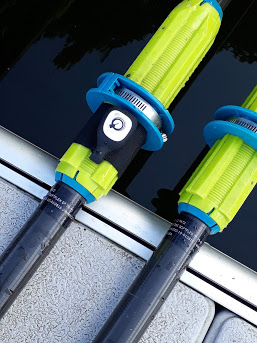
- The Quiske pods that can be
- placed under the seat for analyzing the dynamics of leg/back/arms during the drive and recovery phases
- placed on the oarshaft to analyze blade height, blade acceleration and recovery dynamics
- The NK Empower Oarlock to measure a large number of per-stroke metrics:
- Catch angle
- Finish angle
- Average and Peak force
- Peak force angle
- Power
- Blade slip and wash, and more
Here are a few examples of typical sensor choices we made:
- The person who was working on his bent arms was also really interested in measuring training intensity, so we gave him an Empower Oarlock to learn how to upload data to his training log
- The person who was really insecure and had a short stroke was given an Empower Oarlock with the display set to Catch Angle. During the week, she would be challenging herself to gradually increase that number
- A rower who had a small problem with bum shoving and also a relatively weak second half of the drive phase was given the Quiske pod under the seat
- Another rower, who also suffered from a weak second half of the drive phase but had a problem skying his blades before the catch was given the Quiske pod on his right scull
The next articles in this series will go in more detail on some of the cases.
A typical day at the camp

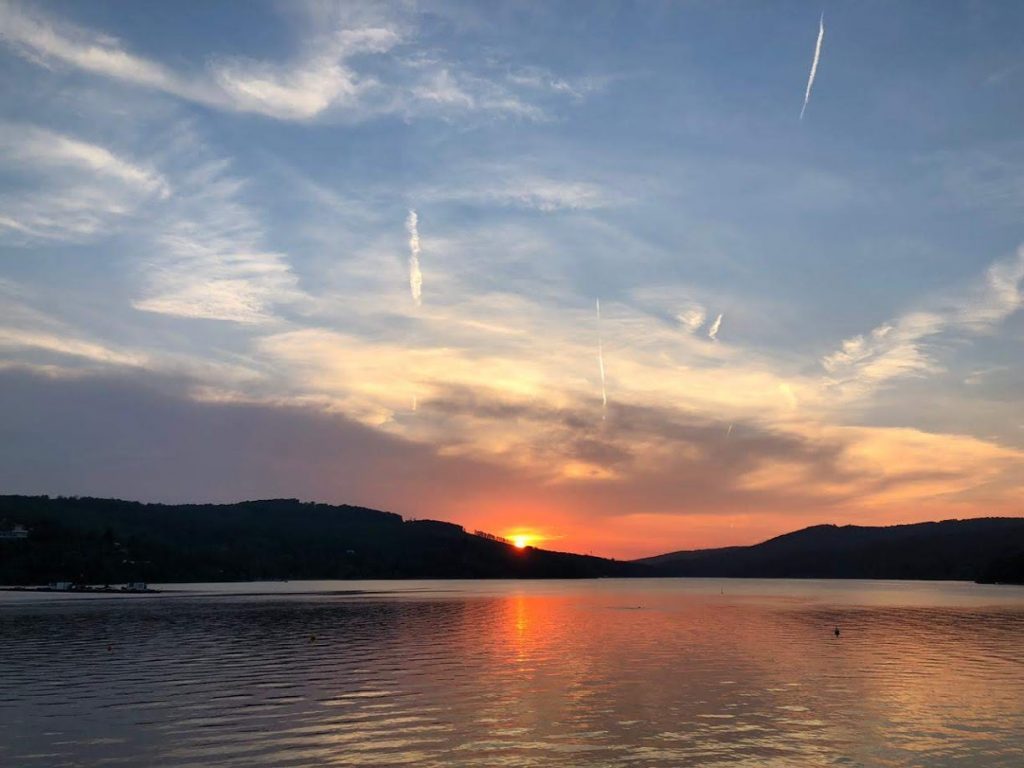
After a breakfast at the hotel (with a view on the lake), participants would arrive at the rowing club around 8am, and we would all be on the water by 8:30. During this session, we would check in with each of the participants to capture them on video and give technique instructions.
After the row, we would have coffee and go through the videos together, pointing out our observations, study slow motion, and see the progress. Participants would upload the data from their morning row.
After coffee, we sent the participants back to the lake for a short session. The participants would do drills alternating with low stroke rate rowing. The coach would be checking in with each of them to give feedback.
During and after lunch, we looked at the data in detail. New insights were discussed, and in some cases we implemented some changes in the rigging, or changed the sensor or the metric to be displayed.
The afternoons were in general lazy. Participants enjoyed the hotel’s spa and wellness, or had a drink in one of the many places around the lake. A third, optional, session was used by those who wanted to get in some interval training or do start practice. During this session, I would row my training alongside the participants and coach them from my single.
In the evenings we had a social program. On Tuesday, we had a dinner in the Palava wine region. On Wednesday we had a seminar on rowing data, where I showed the participants more useful ways to work with rowing data. The seminar ended in time to watch the Ignis Brunensis fireworks competition from the best place to watch it: our dock. On Thursday, we fired up the barbecue and had a pleasant evening chatting about rowing and life in general.
Indoor Rowing
The weather was great, so we didn’t really want to work out indoors, but on Thursday there was some chop, so we decided to take the opportunity to look at indoor rowing.
The Quiske pods have a fun feature called Virtual Coach:
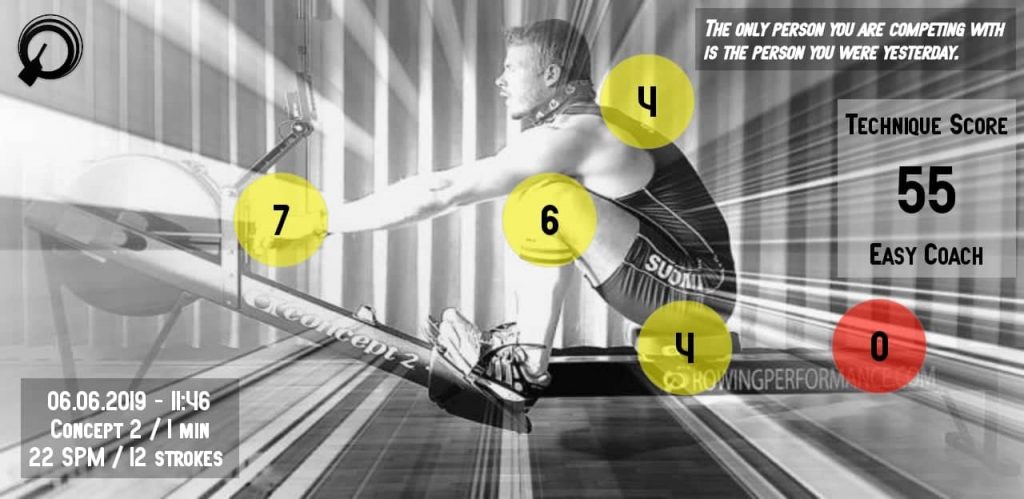 The first thing we tried was to see how all our participants scored on the virtual coach. It was hilarious.
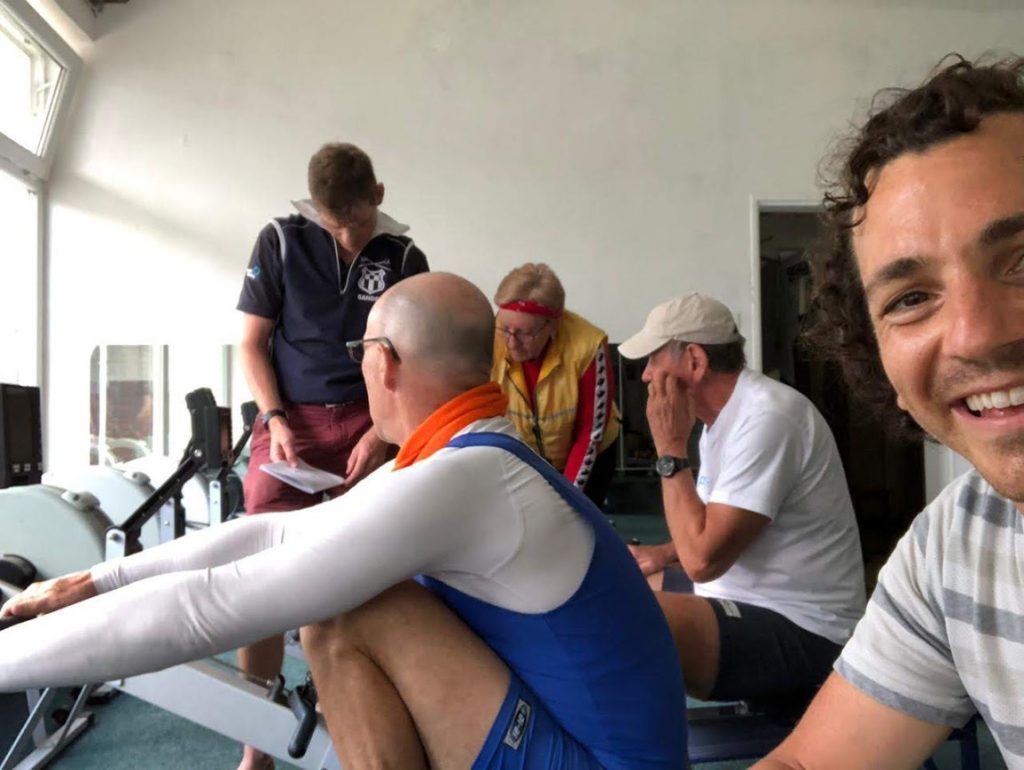 As you can see, we were studying the manual to check the meanings of the different colored balls and understand how Quiske wants us to row.
Of course, we also checked the seat and handle speed curves directly.
Conclusion
There will be a detailed conclusion at the end of the third article in this series, but let me write a few words here.
It was a great week. The setup worked amazingly well. Bringing together world class coaching, focus on rigging the boat to match the body shape and rowing style of the participants, then suggesting improvements based on video analysis and rowing data is a good formula. It works well with limited groups where you have enough time to spend with each participant and find the approach that works for them.
For more information about our camps: https://pryglrowing.com
