How good are you? Ranking workouts on Rowsandall.com
A 2000m erg score is one of the most frequently discussed topics among rowers.
In this post, I will give a quick overview of the functionality that rowsandall.com has to compare your erg scores to those of others, and how you can use the functionality to prepare yourself for your next erg test. I believe that these tools give you a better and more consistent performance, with less drama.
The only thing the tools cannot do is replace your training and produce a miracle erg test result. Actually, the tools are about knowing exactly where you stand, fitness wise, and using that knowledge to accurately predict what your test score should be. You still have to sit down on the erg and do the test, but our tools give you a conservative target for those days when you are fatigued and a realistic but challenging target for good days.
Ranking Pieces
For analysis of your performance, rowsandall.com relies on “ranking pieces”. Ranking pieces are ordinary workouts, marked by you as a ranking piece to be used to assess your performance. Typically, you should mark your erg tests and races.
When you upload or import a piece, it is by default a normal workout, except if it is one of the following official Concept2 ranking pieces:
100m
1 minute
500m
1000m
4 minutes
2000m
5000m
6000m
30 minutes
10 km
60 minutes
Half Marathon
Full Marathon
If you upload one of those pieces and you don’t want it to be a “ranking piece” because it was just a warming up or otherwise anonymous effort, you can remove the “ranking” designation easily. As a ranking piece is used by the site to assess your performance, ranking pieces should be full out efforts or close to full out efforts. With a Basic membership, we support analysis of the Concept2 pieces listed above. With the Pro membership, this functionality is expanded to any workout, including segments of workouts using a tool called “OTE Critical Power”
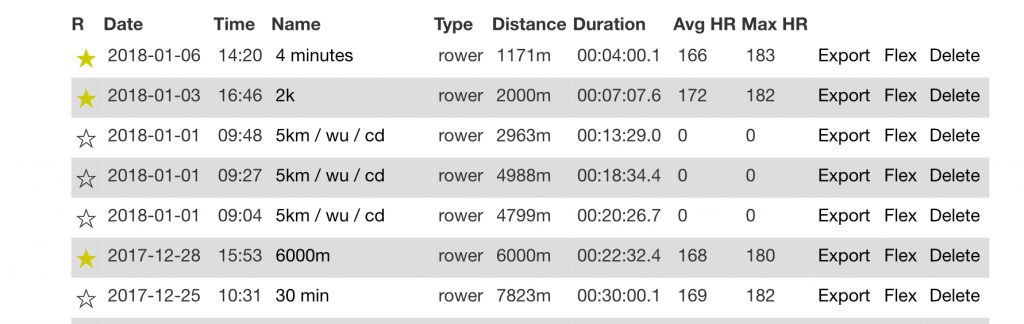
So how do you designate a workout as a “ranking” piece? There are two easy ways to do this. On the Workouts List, ranking pieces are marked with a yellow star, and by clicking on the star you can toggle the status of the pieces:
Workouts List. Yellow stars mark the ranking pieces
In the screenshot above, I have marked a 4 minute effort, a 2k, and a 6k. The fourth workout from the top is a 5k, which I could also mark as a ranking effort, by clicking on the star symbol at the beginning of the line.
The second place where you can change the ranking status of a piece is on its Workout Edit page, which you generally can reach by clicking on the workout name in the workouts view. Rowsandall allows users to configure this behavior to go to a customizable “workflow” page so, if you land on the Workout Workflow page, you can go to the Edit page by the button in the left column. (If you don’t have such a button, you can configure the page to add it.)
Screenshot of a part of the Workout edit page
On the screenshot above, I have zoomed to the interesting part of the Workout Edit page. Apart from several other fields which you should review and update, there is a “ranking piece” check mark, which is checked in this case. By unchecking it and hitting the Save button, you have changed the status of the workout.
The Analysis Page
Once you have a few representative workouts marked as a ranking piece, it makes sense to open the Analysis part of the site.
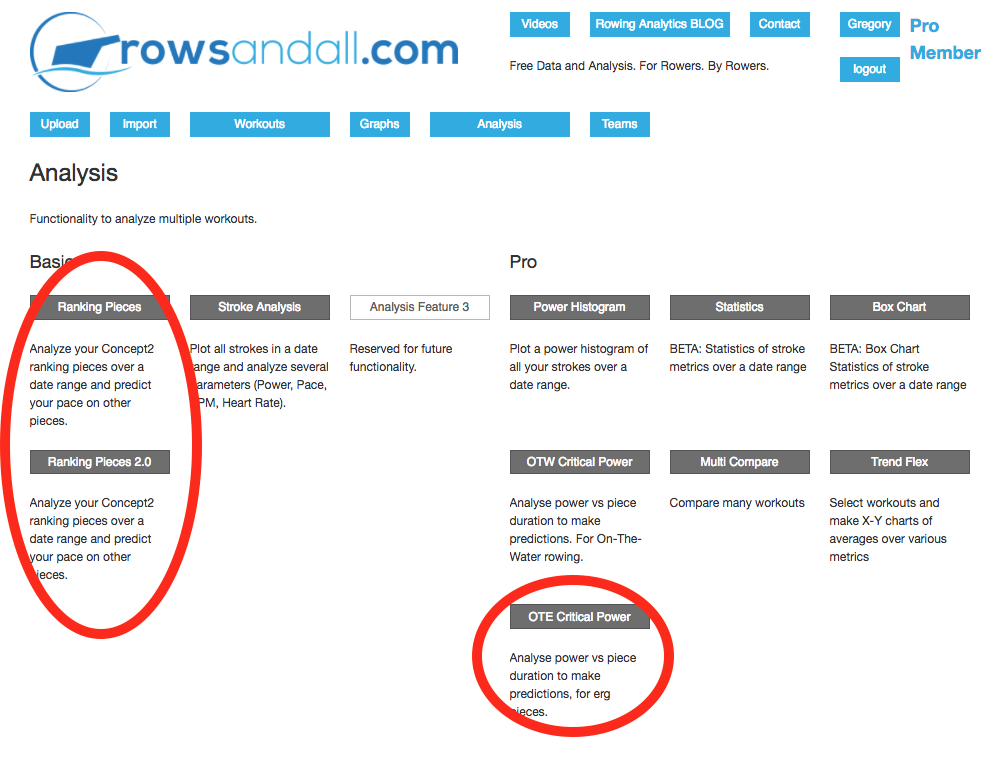
The picture shows the Analysis section on rowsandall.com. All users have access to the functionality on the left. As a Pro user, you can also use the functions on the right.
The functions we will discuss here are:
Ranking Pieces – the original ranking pieces functionality. For power and pace predictions based on your ranking pieces.
Ranking Pieces 2.0 – the upgraded functionality. Does everything that the original function does, and more. See a detailed tutorial in the next section
OTE Critical Power (Pro membership needed) – a cool, alternative way to predict performance, described below. In essence, it is able to take more and different workouts as input and generates two target values (conservative and stretch target) for your erg test
Ranking Pieces 2.0
How does this work? When you open this page, there is a lot going on. You will see a date range form, a chart, and some tables. Don’t panic, it’s all pretty simple.
The “Change Rower” button on the top right is reserved for members with a Coach membership. It allows them to look at the ranking page for people they are coaching.
The date range allows you to define the time period that you are interested in. By default, the calculations are done for the past 12 months, but you may decide to zoom in to a specific period.
For this time period, the site analyses all ranking pieces that are on the official Concept2 list of ranking pieces. (The OTE Critical Power tool for Pro members enables analysis of non-standard distances) However, since most people (and teams) stick to the Concept2 list, you are probably fine.
The next feature on the page, after a short paragraph explaining the functionality, shows the list of workouts that rowsandall has collected that this analysis is based on. This may not be all ranking workouts from the time period you selected. For example, if you did two 500m efforts, the site will automatically consider only the fastest one. By clicking on the names of the workouts, you go to the Workout page, in case you want to change the ranking status of this workout, for example.
The next thing is a busy looking chart:
The Power-Time Ranking piece chart
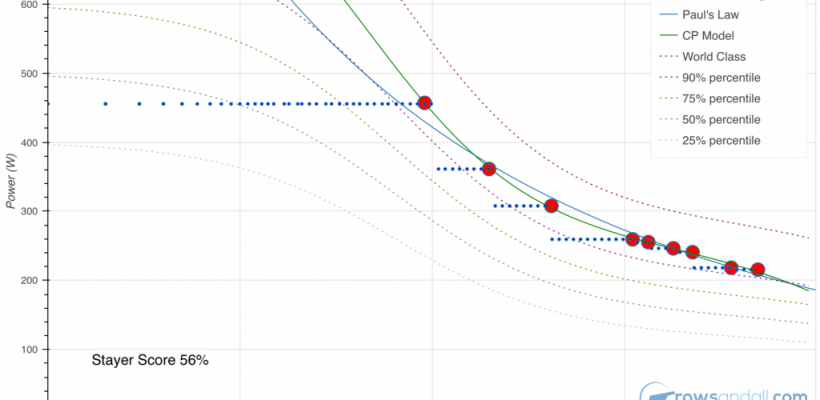
So let’s go through this chart systematically. The horizontal axis is time in seconds, and represents the duration of the pieces. The vertical axis is power (Watt) and represents the average power you held for a ranking piece. The ranking pieces themselves are marked by red circles.
Think of the chart as a representation of your fitness: How long can you hold a certain power level. There is a reason why we are using power and not pace. On the ergometer, pace is an artificial construct (you are not really covering a real distance), while the power you are pulling is real mechanical power output to keep the flywheel spinning. Also, a power/time relationship matches more closely how our bodies work, compared to a pace/distance relationship. Finally, it allows you to take your observations to your OTW rowing, provided you row with a power meter, independent of boat type or wind conditions.
Why Time and Power?
When two competitive rowers meet, the question that is either openly discussed, or lurking in the back of their minds is…I wonder what his (or her) 2k is? And many training plans, coaches, clubs and people focus on how fast you can row a certain distance. This makes a lot of sense, since that is essentially what almost all rowing competitions are, both indoor and on the water. So, why are we talking about how much power you can produce over a period of time? Good question. There are a couple of reasons.First, focusing on how much power you can hold for a specific period more closely lines up with how the energy systems in your body actually work. There is one system that gives you a lot of power over a short period (~10 seconds), another that works over a bit longer period, and a third that provides the ability to produce a lower amount of power for a much longer time.Second, it allows a model to be used that works over a much more diverse group of rowers. Basically, a 2K erg test for a world class male athlete is going to be over in less than 6 minutes. If you are an 80 year old woman, it will take more than 50% longer, over 9 minutes. This means that it will rely much more heavily on aerobic fitness and less on anaerobic.So, all the models here are based on power and time, but they can be converted to pace pretty easily using online tools, like the one on the concept2 webpage.
There may also be some blue dots on the chart. These are power values for segments of your ranking pieces. For example, your latest 6k row may have a 5k segment that is faster than your fastest standalone 5k piece. The blue dots help you to discover that.
Then there are two solid lines. They represent data fits to two common models. The solid blue line is a fit to “Paul’s law”. Paul’s law was popularized by Paul Smith (ps-sport.net), and is often referenced in ergometer discussion groups. It states that if you double the distance, you add 5 seconds of pace. This allows you to calculate a 2k pace from a known 1k pace. The blue line can be calculated from a minimum of two ranking distances, although more is better. On the bottom of the Ranking Page, we will use the fitted values for your erg test pace predictions.
The green line is a fit to an alternative model which we call Critical Power (CP) model. This model is better aligned with how energy systems of your body work, but the downside is that you need three, and better four, ranking pieces in order to calculate the fit. Many coaches use so-called “testing weeks” to get a good view on their athlete’s fitness, and if you do three or four pieces, spread among the short, middle and long distances, you are good.
Depending on your data, one of the two models may be more reliable than the other. Therefore, it is important to check the two curves and determine which one follows the red dots better, and whether it doesn’t generate some ridiculously high or low values.
Then there is a whole set of dashed lines on the chart. The highest one of these dashed lines shows a world class performance athlete of your age, gender and weight class, provided you have set your birth date, gender and weight class correctly in the settings. If you are close to or above this line, you should look up the Concept2 World Records and consider trying to break one. The other lines are derived from observations of typical performances of online ranking results for your age, gender and weight group. The example data in the chart are above the 90% percentile line, which means that the scores are better than 90% of the results that are published online. Similarly, if you are close to the 50% score, about half of the people of your age, gender and weight are slower than you. If you are interested in the science behind how we determine this, we will publish a background article soon.
You may not see the dashed lines at first when you bring up the chart. The site calculates world class and percentile scores in the background and will reload the page automatically when it is done. The calculation will take less than a minute.
Finally, the chart shows the Stayer Score. This is an indication of whether you are more of a Sprinter (like a Jamaican!) or a stayer (like a Kenyan!). From your ranking results and the CP model fit, we are able to determine whether you stayer or a sprinter type. This is also a percentile score, based on the population of people in the Concept2 online rankings. The example chart above shows a score of 56%, which means that 56% of the population are more sprinter-like than this person. This single score can help you understand your strengths and weaknesses, independent of your absolute scores. Values between 40% and 60% indicate a reasonably balanced rower. Outside of that range, you are more of a sprinting specialist (<30%) or distance specialist (>70%). If what you are trying to do is win indoor races, you might want to take this into account in your training plan, for example by increasing the number of short interval workouts, if you want to increase your sprinting skills, or doing more distance work if your stayer score is low.
Pace Predictions
The bottom part of the Rankings Page shows a few tables. The top two tables are your pace and power predictions for the ranking pieces. These values are your guidance for that upcoming erg test. You will have two values, one from the Paul’s Law model and one from the CP model. This is where you remember the chart, and decide which of the two values is more realistic. If the values are close, you will have your conservative and challenge values, and you can decide based on how you feel on the day of the test.
The last table at the bottom is a list of links. If you click on one of the ranking pieces in this table, you will see a chart of world records for your gender and weight class, plotted as power versus age. This gives you insight into which “gold standard” was used to determine your performance.
OTE Critical Power (Pro membership required)
When you open the OTE Critical Power page, there is a critical power chart that shows power on the vertical axis and duration on the horizontal axis, just like the Ranking Pieces chart, but there are some important enhancements.
The Critical Power Chart
Those enhancements are:
The CP chart is built by using all the pieces you have selected for ranking in the time period you selected. It will accept a hard 4k if you did one, even though it is not an official Concept2 ranking piece. Even better, if you did a Just Row on the erg, but you feel that that power burst of a few minutes, starting at 27 minutes and 13 seconds in, was really strong, do mark this workout as a ranking piece and our algorithm will find those few minutes and credit you for it. We built this functionality for the On The Water (OTW) community, where it is not easy to accurately row strict ranking pieces, especially distance pieces, but it turns out to work really well for OTE rowing as well.
Because the CP chart searches for fast segments across all your ranked pieces, you don’t need as many separate ranking pieces before the fit becomes useful. For the basic Ranking Pieces page, you need at least three and preferably four separate ranking pieces to get a successful fit. On the CP chart, one 5k already gives you an initial estimate. Of course, the more pieces you do, the better the result.
The CP chart automatically calculates a conservative estimate and a stretch goal. The conservative estimate takes into account all data points. The stretch goal is based on the best efforts the algorithm detects, but uses the shape of the curve obtained from fitting all data points. In the chart above, you can see how the red line uses the best efforts across the entire range, while the green line goes through the average of the points, which is a bit lower because of the lack of full effort performance in the 1 minute to 4 minute range.
Our testing using the chart to pick target paces has shown that the green line, if based on sufficiently recent results, is a very good estimate of the performance level you should be able to do on any day, after a good warming up and provided you are not sick. If you are well rested and mentally ready for a challenge, you can shoot for the stretch curve and probably succeed. Now, if you show up at practice after a really hard training week, and the coach announces a surprise 2k test, you can get out your smartphone and quickly check the prediction tables on rowsandall.com, and aim for the green curve. That will give you a confident pace, and any Watts above that is your victory.
Conclusion
By using the ranking functionality on rowsandall.com, it becomes really easy to answer the following two questions:
How good is my performance compared to others, given my age, weight class and gender?
What pace should I aim for on my next erg test?
Using this takes the guesswork and drama out of erg testing. You will never have to go through the pain of starting too fast and then crashing any more. Your coach will see how consistent (and, hopefully, consistently improving) your scores are. It is this consistency that will bring you in the top boats, even if your scores are slightly lower than the best scores of your less consistent competitors.
The (free basic membership required) Ranking Pieces chart uses the Concept2 world records as the gold standard and the online ranking results of the worldwide rowing community as a way to establish how good you are.
The Stayer Score is a handy way to determine your strengths and weaknesses and should be taken into account when building your training plan.
The Critical Power model does the same but already works from your first ranked workout. It also gives you a fallback value for surprise erg tests on days when you are not in top form.
We use cookies to ensure that we give you the best experience on our website. If you continue to use this site we will assume that you are happy with it.Ok