
On Rowing Metrics
Rowsandall.com is about rowing related metrics. Basically, you record as many parameters related to your session as you can, and Rowsandall.com enables you to visualize them.
The goal is to give you a tool to measure how you are progressing towards your goals, help you row faster and more efficient, and in this way enable a quantified approach to training for everyone who is interested.
What is a metric anyway?
We are equipping our bodies and boats with sensors that can measure signals. For instance, we measure GPS position, electrical signals related to our heart beat, etc. In physics, stuff you can measure is called a “quantity”. Or to say it more respectfully, a physical quantity is a physical property of a phenomenon, body or substance, that can be quantified by measurement. It can be expressed as the combination of a magnitude expressed by a number and a unit. All quantities can be expressed in terms of seven base quantities:

An addition to these seven quantities, we need
- Plane angle (radian, rad)
- Solid angle (steradian, sr)
All other quantities (or metrics, as we have come to call them in sports) are derived and their units can be expressed as combinations of the above. To define a (rowing related, or any other) quantity/metric, we need to agree how to measure the physical quantity, which involves its definition in terms of one of the base quantities. For example, speed is the distance covered divided by the time it takes to cover that distance, and thus it is measured in meters per second (m/s). In rowing, we have pace, which is the time to cover a distance of 500m, so it is measured in seconds.
This definition process is extremely important to understand what the quantity is, and how we can use it to improve our rowing. Some developers consider the way they calculate a metric a trade secret. That is of course their free choice, but it hinders developing a good understanding of what the metric can be used for.
Force, Work and Power
Newton’s first law states that the rate of change of momentum of a body is directly proportional to the force applied, and this change in momentum takes place in the direction of the applied force.
In other words, the net force applied to a body produces acceleration.
The unit of force is kg m/s2 also known as the Newton (N).
For example, in order to deadlift a mass of 100kg, you need to overcome the gravity of 9.8 m/s2, and thus you need to apply a force greater than 980 N.
Rotational force, or torque is defined as the force applied to the distance of the application point to the fixed suspension point (the pin, in the case of rowing).
On to work. Work is the force applied times the distance. In the deadlift example, if you lift the 100kg mass by one meter, you have applied 980 N of force over 1 m of distance, and the work is 980 Joule (or 980 kg m2/s2). Note that if you hold the weight at 1m above the ground, you are not exerting any mechanical work, even though your perception is different.
For an angular motion, Work is Torque times angular distance, which is relevant given that oars rotate around a pin.
Finally, power.
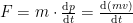
Power is the amount of work you do per unit of time, and it’s unit is the Watt (. Hence, it is the product of velocity and force: If you lifted that 100kg mass over 1 meter in 1 second, the power is 980 Watts (or 980 kg m2/s3).
The image above gives a nice explanation of force, work, power, and how they interrelate.

Basic Rowing Metrics
In on-the-water rowing, we are interested in maximizing boat speed over a given distance. Actually, we are interested in the maximum average boat speed we can achieve with our body, which means rowing at the maximum power our body can deliver over that distance, and to do this in a way that transfers as much of that power into boat moving power, i.e. moving the boat as efficiently as possible.
By rowing, we deliver energy to the system and accelerate the boat. There are, however, not only energy sources but also energy sinks. Energy dissipates in fluid drag, in puddles, and in your body as heat.
Let’s recap:
- Exert maximum power our body can give for the race distance (and its duration)
- Use that power as efficiently as possible – maximize boat speed
The second point, efficient rowing, means:
- To minimize energy dissipation in puddles
- To minimize drag dissipation
The first point means that some stroke force curves may be more efficient than others. Creating a big puddle is not a good thing. It means that you have wasted energy in stirring up water, instead of sending the boat forward.
The second point means that there may be a way to gain boat speed by optimizing the recovery.
How much can you gain by optimizing technique? A few seconds on a 2k. Not a lot in the grand scheme of things, but it could be enough to win a race.
Let’s park the efficiency discussion for a minute and get back to rowing metrics. We are interested in maximizing boat speed over the race distance. This means that as a minimum we are interested in:
- Time
- Position
- Boat speed (or pace, because of the convention in the rowing community)
- Mechanical power delivered by the athlete
Note that boat speed is calculated from 1 and 2. Also note that only recently, we see devices on the market that are able to measure 4. It was about time. Each of those devices measure power in a different way. Some measure at the oar shaft, some at the oarlock. With the proper measurements of your rigging, all these measurements are can be related back to:
- Handle force
- Oar angle
These are sufficient to calculate the instantaneous power at any point in the stroke. (In reality there are some finesses that I have omitted. Refer to the book by Kleshnev at the bottom of this post for more details.)
Oar angle is interesting because we can move the footstretcher and thus change the catch angle, and we can play with the catch and finish angles (within the limits of our body) by making longer and shorter strokes.
Measurement devices measure instantaneous values of these quantities, but they usually report the average (and peak) value over a stroke cycle.
To derive meaning from the average value of a quantity over the stroke cycle, you will also be interested in measuring the
- stroke frequency (stroke rate, cadence), in Hz (1/s), but in rowing it is usually expressed as strokes/minute.
Finally, heart rate is a proxy for how hard you are working, so it is useful to measure it.
Ideally, we should also measure the following environmental quantities:
- Water temperature – important to estimate boat drag
- Wind speed and direction – additional drag
- Water flow (velocity, direction) – without it, GPS speed is not very useful on rivers
However, we have to distinguish between the ideal and a practical approach that enables people to take useful measurements every training, and not spend too much time preparing the measurement and the analysis. You want to go rowing, measure a bunch of data, upload them, and have a quick look at the most important metrics.
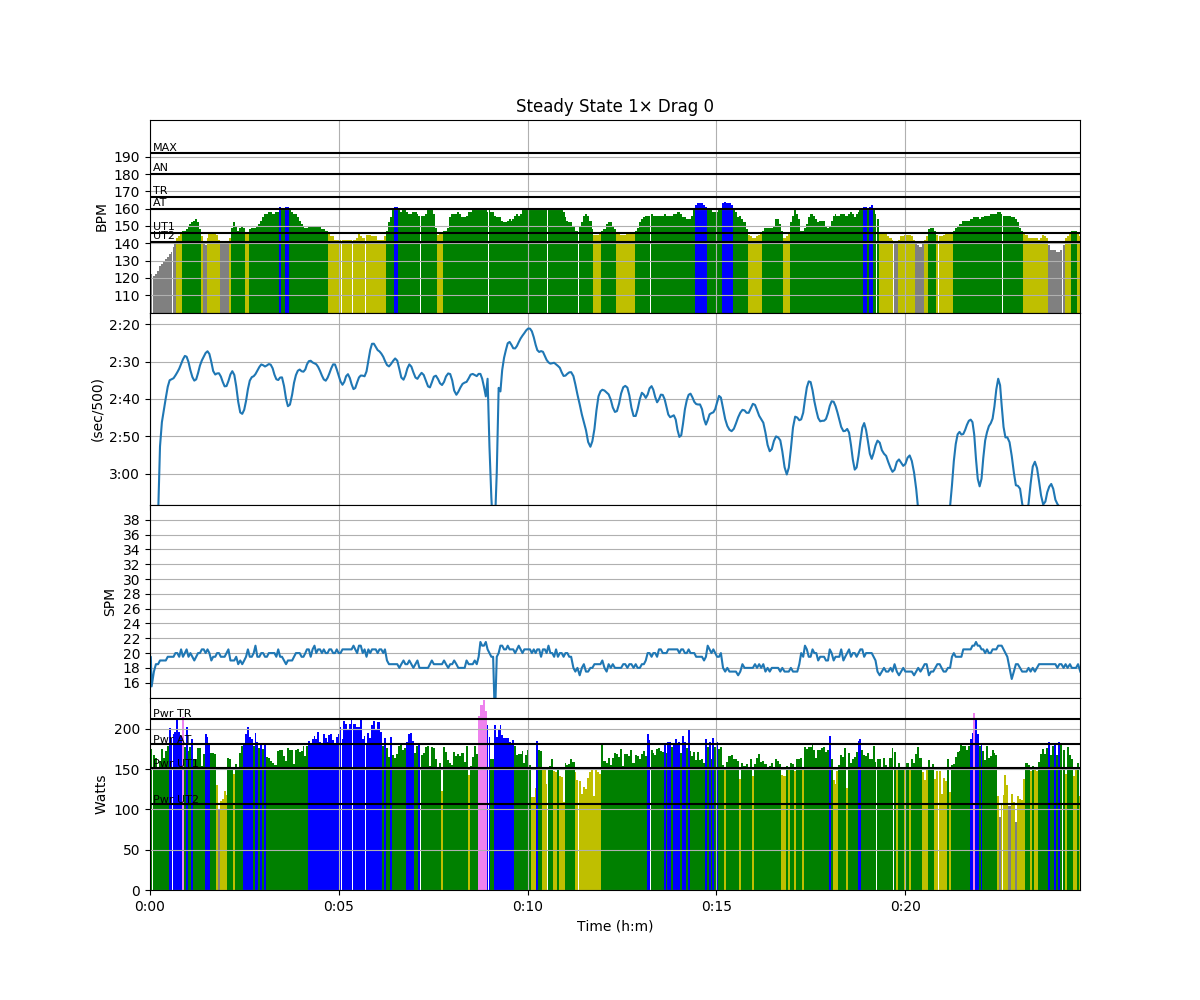
Rowsandall.com’s basic charts give you all the basic metrics in one view:
On top of these, there are a few more per stroke metrics that I consider basic. Therefore, rowsandall.com supports the following metrics for all data sources and does its best to make the data interoperable between multiple data sources:
- Average speed (or pace)
- Stroke Rate
- Average power
- Average handle force
- Total oar angle
- Catch angle (and finish angle)
- Total work per Stroke
- Heart rate as a proxy of your physiological reaction to the mechanical work your body is doing
These 8 (6+2) quantities accurately define how hard we are working and how much boat speed we get out of that. Of course, if the data source doesn’t contain one of these metrics, and the metric cannot be derived from other measurements, it is omitted.
Technique Matters
Above, we have discussed briefly how the recovery and the stroke profile can influence the mechanical efficiency of your rowing. The 8 quantities are not enough to measure this. They are not enough to differentiate on technique, and we all know that technique matters. Apart from basic technique flaws, there are also differences in rowing styles, and we need a way to measure technique, and we also need a way to link technique to efficiency. Otherwise, we are not doing science but only some sort of quantitative description of what we see.

Drag force depends on boat speed during the drive and during the recovery, and the force profile at the blade determines the amount of energy dissipated in the puddles. Therefore, it seems logical that one needs to measure
- Boat speed (and boat acceleration as its derivative)
- Seat position/speed
- Handle position/speed
- Handle force (and footstretcher force)
- Boat roll, pitch and yaw
Note that rowing is a 3 dimensional sport. The four parameters above are measured in all 3 directions. We have vertical boat and handle movement, seat movement, and we may even have lateral movement, as well as boat roll (balance). And the above list is actually incomplete. One can add the position and rotation of various body parts (especially in sweep rowing).
But again, we are trying to reduce the above measurements to something that is practical and measures those quantities that have the biggest effect on efficiency.
There are expensive systems on the market that measure virtually everything, including the athlete’s hair style and the impact on wind resistance. But we want to improve our rowing, not drown in data, and we are trying to find a practical system that gives us “just enough” to understand what needs to be improved in our technique.
The point is that we have no common understanding of what is “just enough”. The good news is that we now have a couple of manufacturers selling systems that can measure some of the quantities listed above.
Rowers actually using these systems, collecting data, and discussing them is a great way to figure out what a good system is. This forum (and the Rowing Data Analytics Facebook group) is an excellent place to have that discussion, and I hope to see many contributions to the debate.
Technique related Per Stroke Metrics
As said above, we don’t want to drown in data. After a row, we don’t want to look at each stroke profile and velocity profile for each stroke we did. Also, we want to quickly find parts of a workout where we were improving, and parts of a workout where we were falling back to our old mistakes.
To do that, it would be great to have some per stroke metrics, derived from the in stroke dynamics, that tell us with one number how good this particular stroke was, efficiency wise. People have tried to come up with those metrics, and here is a short list of obvious ones.
- Bounce (measured in Tiggers?)
- Boat Check?
- Average and maximum seat speed?
- “Catch Efficiency” a la Rowing in Motion?
There are many more. Already today, apps like CrewNerd offer “Bounce” and “Check” and Quiske offers the oar angular speed and seat speed metrics.
Are these useful metrics? To answer that question, we need to agree on what a useful technique related per stroke metric is. Here is my definition:
- A per stroke metric with a proven relation to rowing efficiency1 or a one to one correspondence with an accepted technique flaw, like missing water
- The metric is “coachable”, i.e. one is able to explain what a rower should change in his rowing motions to improve the metric
- Is not influenced too much by factors outside the rower’s influence, like chop, or small variations in stroke rate from stroke to stroke.
Ideally, the metric should be completely independent of stroke rate, but I will not make the requirement stricter than number 3 above. Why is it better for a metric to be independent of stroke rate? It would allow you to find whether you are rowing more efficiently at 33 spm vs 36 spm, which is important information to know.
Adding technique metrics to rowsandall.com
I have long been reluctant to expand the metrics offered on Rowsandall.com beyond the “basics” given above (although I admit that I made an exception to Wash and Slip from the Empower Oarlock), but I see how Rowsandall.com can also be a place for people to experiment and figure out which of those “extra” metrics are actually useful.
So as of today, there are two improvements that help our discussion on technique metrics.
- For data sources that record some in-stroke data, we are giving you access to them.
- We are offering all per stroke metrics that the data sources have, for you to use at your own risk
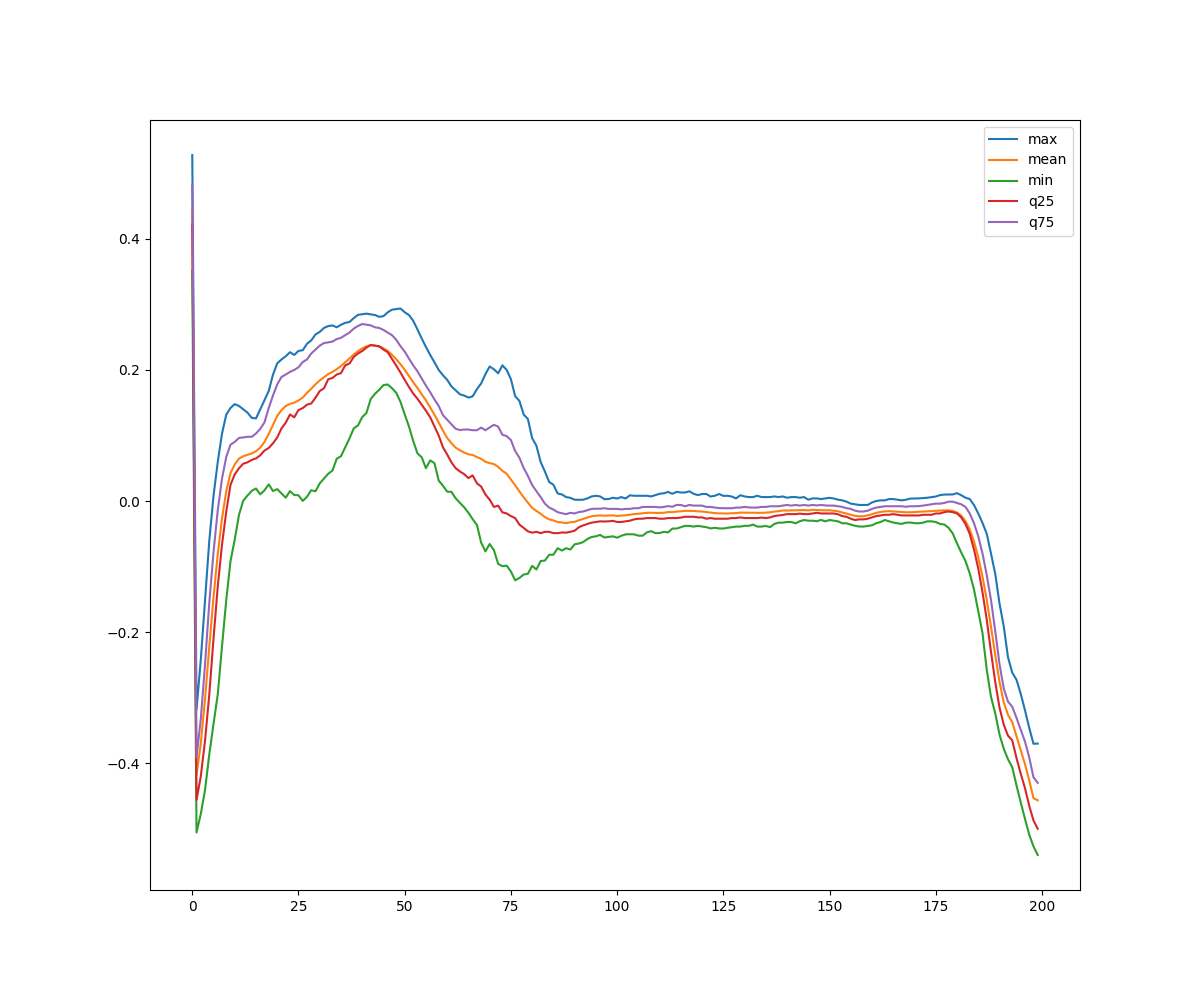
Regarding the former, the current implementation on rowsandall.com is a simple chart that is accessible through the “In Stroke” button under the advanced menu:
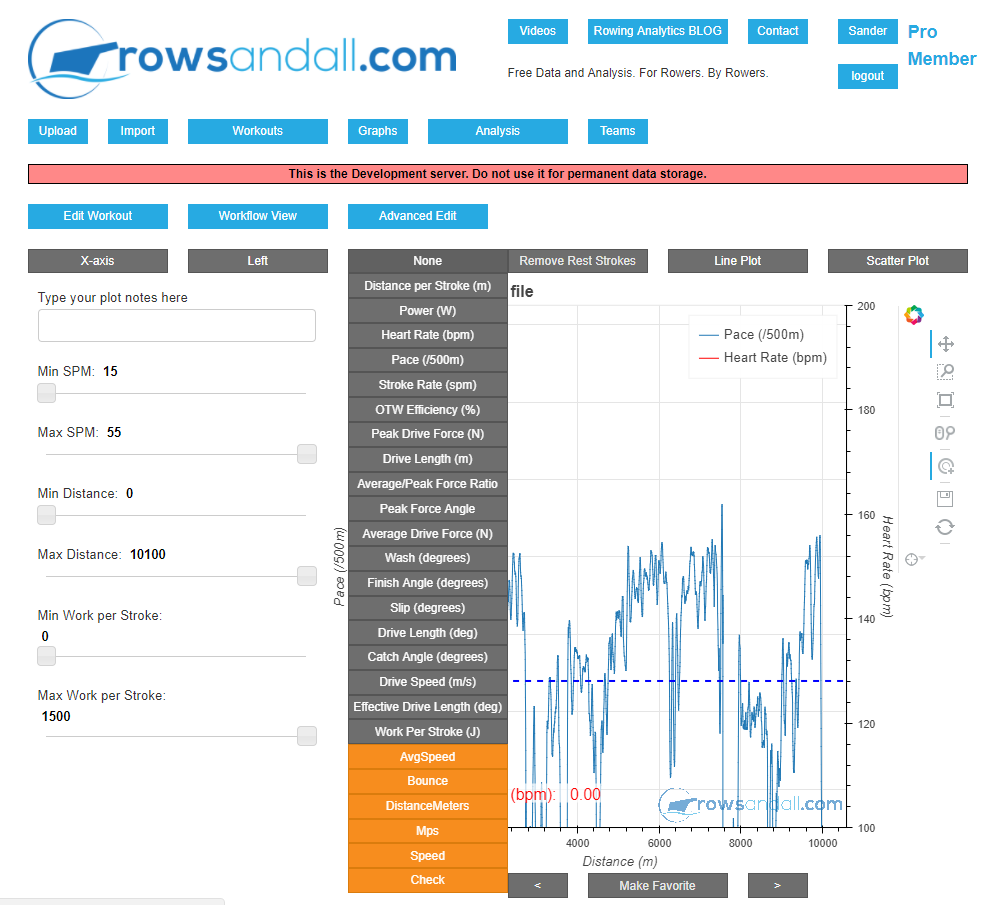
Regarding the latter, you can use “extra” metrics in the famous Flex Chart (which you can find under the Advanced edit menu) or on the Workflow page of your workout, if you have configured it as such. These metrics are marked with an orange color, and they are available for Pro users. Like this:

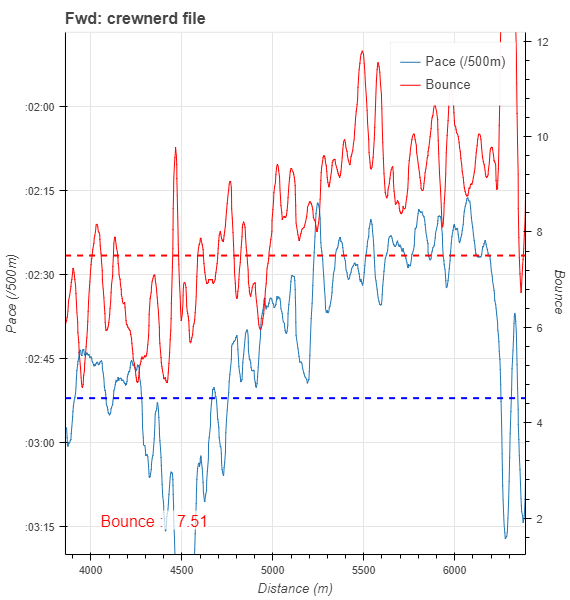
This is an example of a CrewNerd TCX file uploaded to Rowsandall.com (actually, to our development server). CrewNerd exports a couple of non-standard quantities in its TCX: Bounce and Check. The image also shows a few others, “AvgSpeed”, “DistanceMeters”, “Speed” and “Mps”. It is pretty clear what those are, but Bounce and Check are metrics derived from in-stroke dynamics and claim to be telling something about the “quality of your rowing” (which I take to be the same as technique, or efficiency). See CrewNerd’s own descriptions for more detailed info.
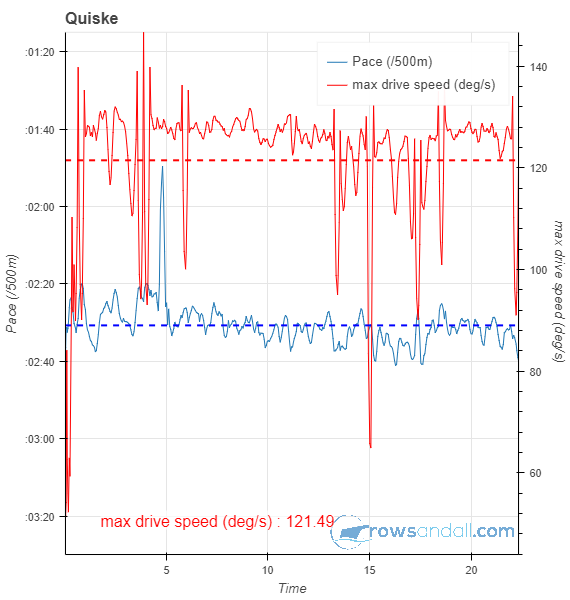
Similarly, BoatCoach exports a few extra metrics, and so does Quiske (oar angular speed, seat speed).
On the erg, RowPerfect RP3, PainSled and BoatCoach provide additional metrics, and even RowPro has something.
The way this works is that the Rowsandall.com software scans for any additional information in the uploaded CSV or TCX file and takes note of additional data columns. For the basic rowing metrics, things are nicely mapped and we keep a unified terminology and data treatment across all sources of data, independent of your recording device or app. For the additional metrics, you are on your own. We don’t know the unit. We don’t pretend to know how to use it.
The challenge is actually for us to find out how to use it, and if we agree the metric is a useful one, I will “promote” this unit and start supporting it in the standard rowsandall.com way.
Further reading: [amazon_link asins=’1785001337′ template=’ProductAd’ store=’rowingdata-20′ marketplace=’US’ link_id=’369f8533-d77c-11e7-9763-25ab662e877c’]
- Rowing efficiency increases when boat speed increases at the same mechanical power, or when the same boat speed is maintained at a lower mechanical power. Of course, this is defined in no wind conditions and at constant water temperature. ↩