
Introduction
As I wrote in this blog post, power measurement systems for on-the-water rowing are about to become mainstream. In fact, since the launch of NK’s Empower Oarlock, there is an affordable way to get started with measuring the power you put into rowing on the water. On the erg, we have always had power, but somehow it is rarely used. The entire rowing community has become addicted to a weird metric “pace”, expressed as the time it takes to cross a virtual distance of 500m.
There is no real distance on the erg. All there is, is an accelerating and decelerating flywheel, and all metrics are measured from that. Power can be derived directly from the flywheel speed. On the water, there are external factors which make that you sometimes have to work harder to maintain the same pace, and do more physical work to cover the same distance. Headwind. Current. A bungee cord.
What is power? Power is the amount of work you do per unit of time, it is the rate at which you work. Also, it is the product of handle speed and handle force. And work is the product of force and distance. All these things are extremely important parameters in rowing. Think about it:
- Handle force
- Handle speed
- Drive length
- Strokes per minute
All these things are directly measured on the erg. They can be combined to measure the physical work you put into rowing. And training is about doing physical work (in a smart way) and recovering from that work, for your body to adapt itself and be able to do do more physical work, or sustain a higher power for longer, or do the same amount of work with a lower perceived exertion.
Rowing with a power meter can be used to
- Know your strengths and weaknesses
- Share row workout data with your trainer or team members, even if they trained at a different time, with different conditions
- Establish objective, measurable, quantitative goals to train to
- Tuning your training load to achieve optimum race performance
Some of these goals can also be achieved by training by heart rate or using lactate measurements. The disadvantage of using heart rate is that the external influences (caffeine, temperature, humidity, stress, fatigue, race adrenaline) can lead to huge heart rate swings. For example, I would never let my race pace be determined by heart rate. The disadvantage of using lactate measurements, is that it is cumbersome, expensive, and hard to do on the water. I am not dismissing these two methods, though. In fact, I think you should always measure your heart rate (because in combination with power it can tell you something about stress, fatigue, fitness) and using lactate measurements can be a really smart way to establish personalized training goals.
Rowing with a power meter (background reading)
This post is about how to use rowsandall.com to use power to improve your training (and get faster). As preparatory work, you should probably read the following background material and introductions:
- Power Measuring in Rowing – my review of the book “Training and Racing with a Power Meter”.
- How to get started with training with power – A blog post by Hunter Allan, one of the authors of the above-mentioned book
Now that you have a basic idea of how triathletes and cyclists use their power meters, it’s time to get started with rowing. This is all you need:
- A Concept2 rower
- A way to extract your rowing data from the erg. See this blog post and this blog post. Personally, I recommend Painsled (for iOS) and BoatCoach (for Android) because they give you the most metrics
- A heart rate belt (we’re not ditching heart rate measurements)
- A login name on rowsandall.com. The basic registration is free. For a mere 5 EURO, you get all the full functionality, but the basic plan is good to get started.
- Optional: Power meter in your boat. Rowsandall.com is ready for the NK Empower Oarlock.
Also, take some time to get acquainted with the Concept2 monitor (the “PM”), especially how to set it to Watts. You’re going to use the Watt screen quite a lot.
How to use Rowsandall.com to improve your training with Power
Establish Power training zones and organize your training around them
Setting the Zones
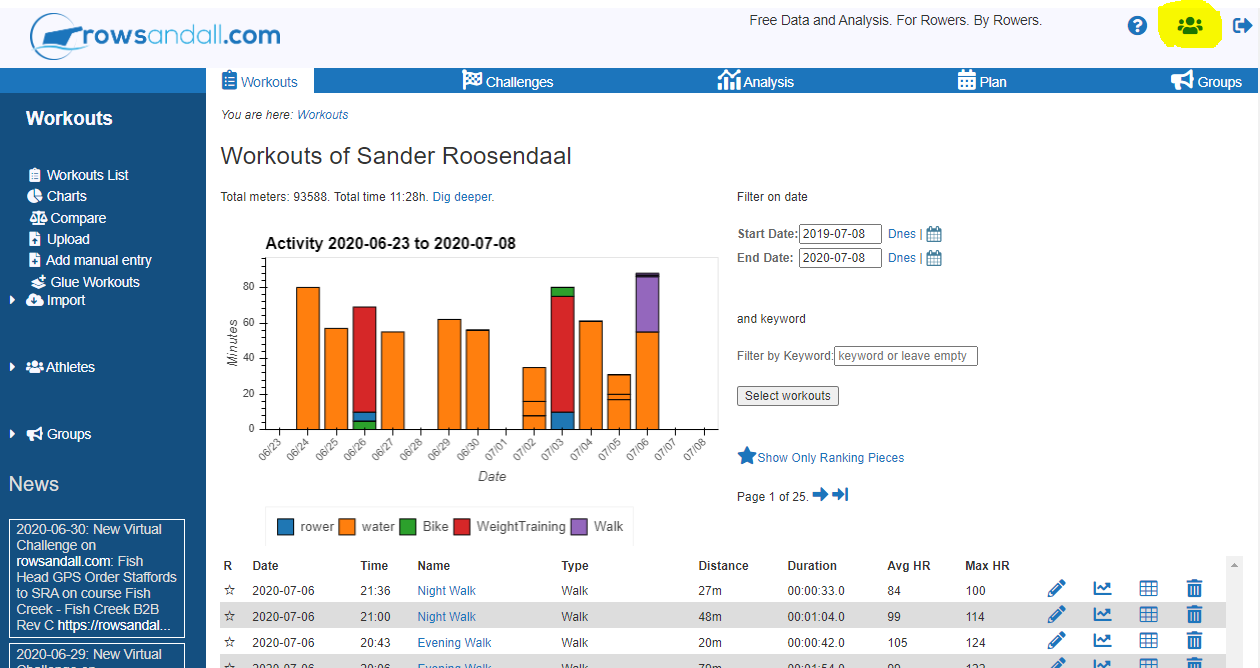
First, head over to your settings page. On rowsandall.com, you get there by clicking on the the user icon on the top right of the page.
This is the Settings page:
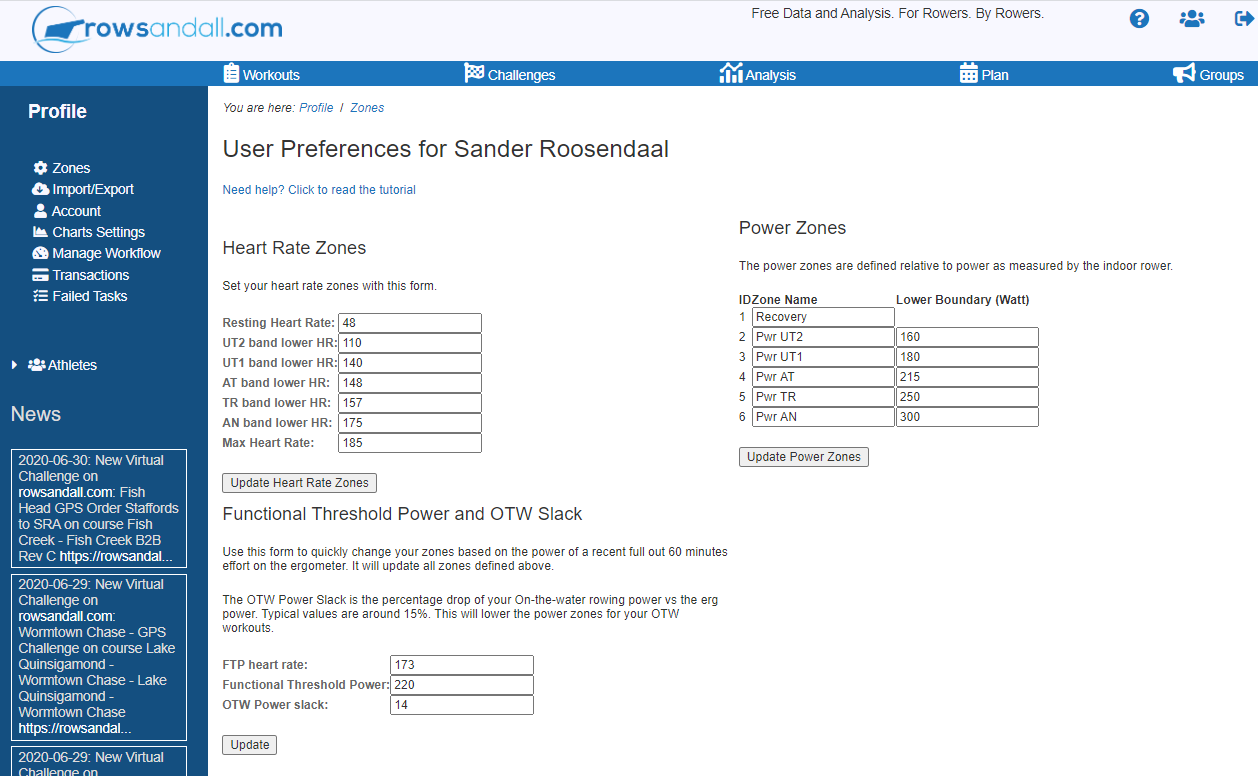
If you read this in the future, the layout may have changed slightly, but the functionality should be roughly the same. There are three forms on this page.
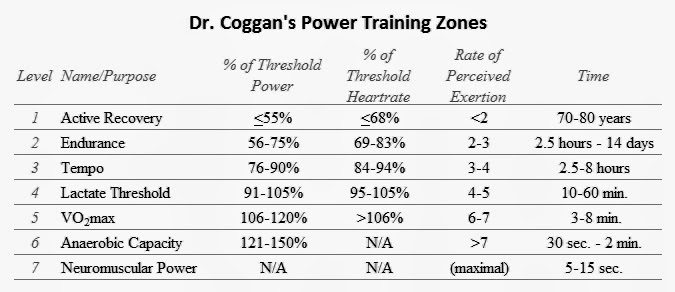
- On the top left, you have the Heart Rate Zones. Here, we use the usual heart rate zones for rowing. On this page, you will find a nice calculator to figure out what the zones are for you. UT2 is light aerobic work, UT1 heavy aerobic work, AT the aerobic threshold, TR oxygen transportation zone and AN is the Anaerobic zone. The weight category settings is important for synchronizing your workouts to the Concept2 logbook. (I will probably reorganize this form a bit in the future, and make it look more like the Power Zones form on the top right, but for now this is what you have for Heart Rate zones.
- On the top right, you have the Power Zones. In the figure above, I use my own definition, but you are free to define your own zones, including their names. Just type the new names and hit “Save”.
After updating the names and saving the form, I have the following:
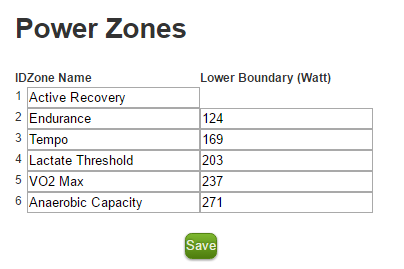
So now I am all Cogganized. For new users, the zone boundaries are set to a default value, which follow the percentages in the table above, for a threshold power of 226W. You will want to change that soon, but for now don’t touch those boundary values yet. First you will want to set your FTP.
The third form is specially made for that. This is where you put your Functional Threshold Power (in Watts). How do you determine your Functional Threshold Power? It is basically the maximum average power that you can sustain over 60 minutes. Here are a few ways to obtain a value for your FTP:
- Dial up a one hour effort on the erg and row. Write down the average Power.
- Row a full out 20 minute effort. Write down the average Power. According to triathlon sources, your FTP is roughly 95% of this value. For rowing it looks a bit lower, somewhere in the 80% to 95% range. Actually, the famous “double the distance, add 5 seconds of split” rule suggests that FTP is 81% of the 20 minute power for heave Men, to 85% for lightweight Women.
- Row a full 30 minute effort, take 90% of the power. I derived this figure from Concept2 Rankings.
- Row a full out 2k, take 60% (Men) or 70% (Women). Guidance that I derived from Concept2 Rankings. Older men may be closer to 70%.
- Make a wild guess
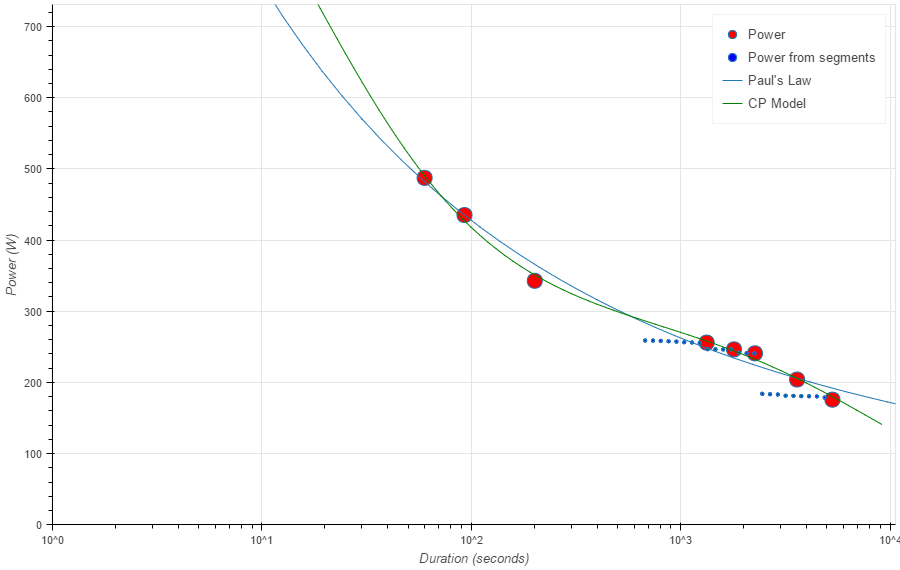
- Use the Ranking Distances page on Rowsandall.com to estimate your maximum performance over 60 minute. More about this in the next section.
Now that you have (a guess of) your FTP, fill that in the third form and hit “Save”. You will notice that also the zones boundaries in the Power Zones form have changed. They have been recalculated based on your old FTP value and your new FTP value. So, for example, if the lower boundary of your Tempo zone was set to 169W for a FTP of 226W, and you changed your FTP to 200W, your new Tempo zone boundary will be proportionally lowered, to 149W.
If you want to adhere to the percentages rules for the zones in the table above, you’re good to go. But you may want to use a different definition of Power Zones. You can simply do that by calculating your zone boundaries according to your favorite equation or table, use the Power Zones form to adjust the naming and the values, and hit “Save”.
The cool thing is that when you train and get faster, your FTP will shift. You can use the FTP form to adjust all your zones in one go, by just updating the FTP value.
What was my training zone?
Now we’re all set up. Go and do a workout. Upload it to rowsandall.com. And then follow the instructions in this article to create a nice colored chart showing you in which zone you were doing your workout.
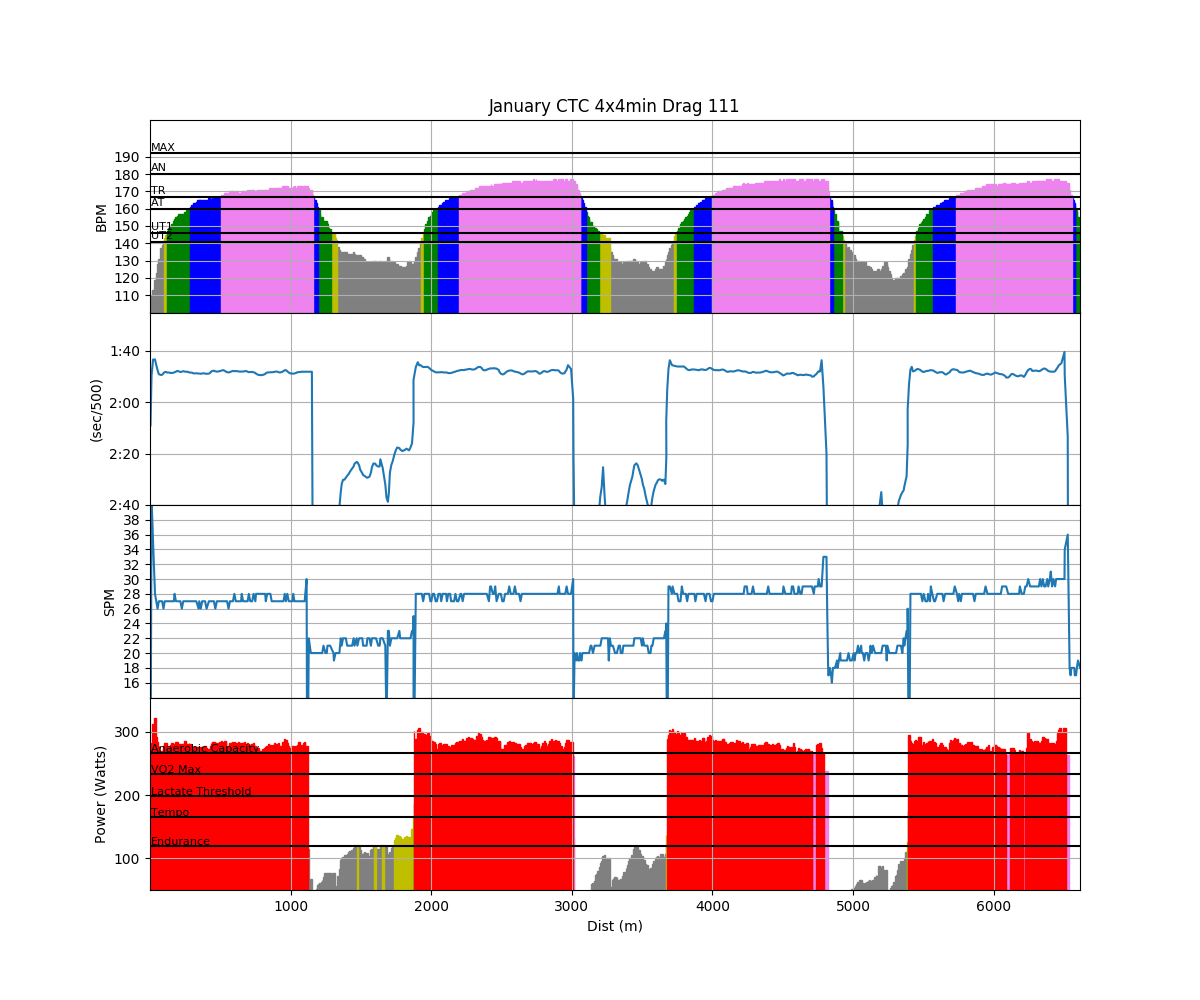
We’re going to focus on the top and bottom of these charts. On the horizontal axis you see the distance you have covered in the workout (hence “Distance Plot”). In the top chart you see your heart rate as a bar chart, with the color of the bar representing the Zone you were working in. For clarity, the Zone names are indicated on the left. In the bottom graph, a similar thing is going on, but now with the Power you were working at, and the colors indicate the Power Zone. In this 4x4min workout, I was working in the Anaerobic Capacity Power Zone exclusively. Contrast that with the heart rate values, which are mainly in the TR zone, but because heart rate responds slowly, there is also substantial time spent in the AT and UT1 zones. The two middle charts show you your pace and the stroke rate. Compare pace to Power. The two are related, but I find it much easier to spot fast and slow sections (“power 10 strokes”) in the Watts chart. The reason is that the power you need to gain a 1 second pace improvement quickly increases with pace, so the faster you row, the harder it gets to speed up. The Watts chart really shows you how hard you have been working.
The Distance and Time charts are really nice to get a quick overview of the workout. I recommend creating these charts every time.
Here are a Power Pie chart (left) and a Heart Rate Pie Chart (right):
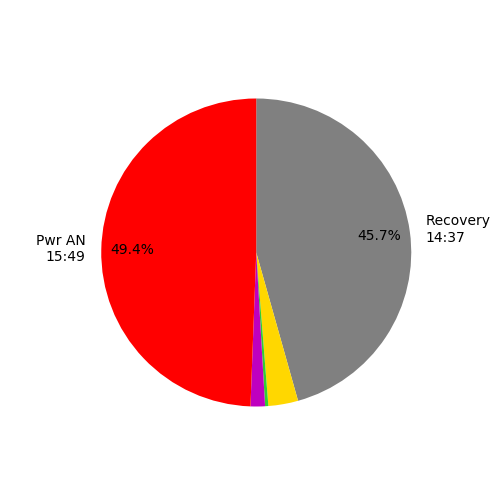
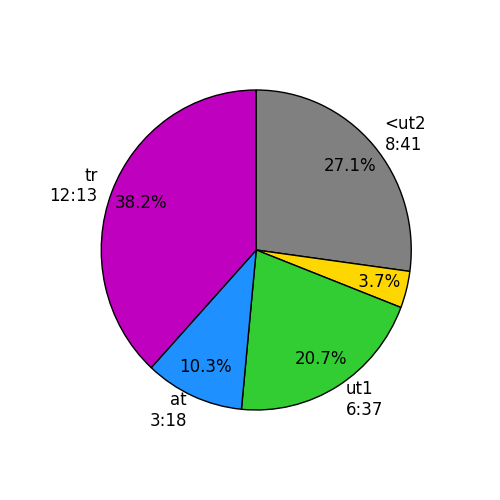
You can click on the images if you want to see a larger version. These Pie charts tell you per Zone how much time you have spent in that particular zone. So for example on the Heart Rate Pie chart, you can see 12:13 minutes (38.2% of the total workout duration) at a heart rate in the TR zone. If you are planning your training according to Power or Heart Rate zones, you can use these charts to see if you really have been working at the right level.
In the Advanced section, you can do a Flex Chart. The Flex Chart is worth a blog post in itself, so I won’t go into much detail, but you can basically plot any measured parameter against any other parameter in number of ways. Users of the free Basic plan have access to distance, time, power, pace, heart rate and stroke rate, and Premium users get a whole bunch of additional metrics. Here is just one example, but you can basically generate all the charts that I prototype in my book review: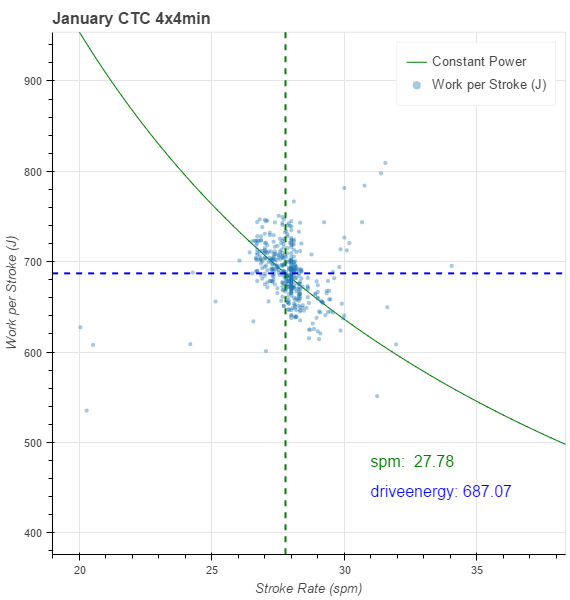
Premium users also have a useful other plot, the Power Histogram:
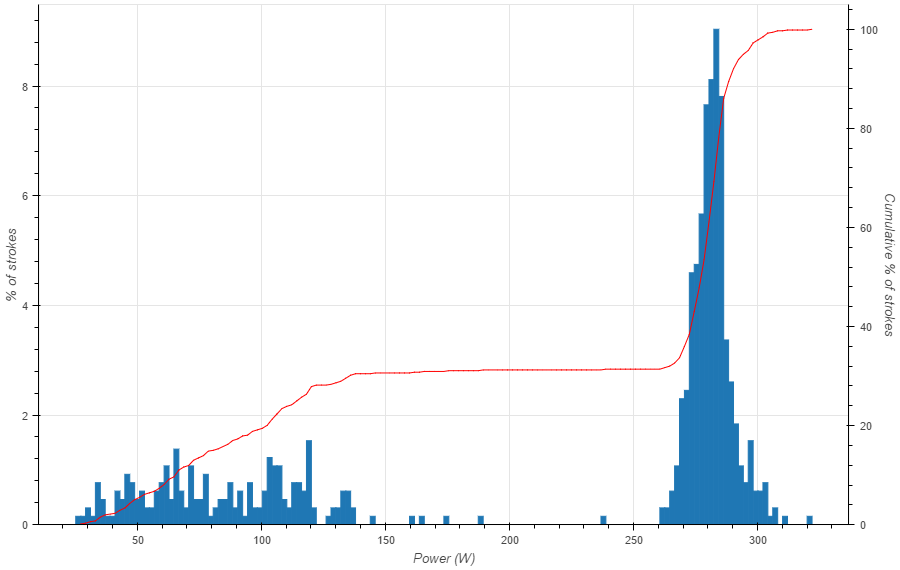
In this plot you have Power on the horizontal axis and the percentage of strokes on the left vertical axis. This chart is interesting to see at a glance how your power was distributed. For this workout, the power was in a narrow band around 270W for the “work” intervals, and a broad band between 10W to 150W for the “rest” intervals. The narrow band in the work interval is a good thing. You want to pull flat and consistent.
Monitor your training load
This is an area where Rowsandall.com has a large number of different tools, and each of them gives you a slightly different piece of information:
We have posts on this site on most of the tools, and we’re constantly offering new tools. Use the Search field to find information.