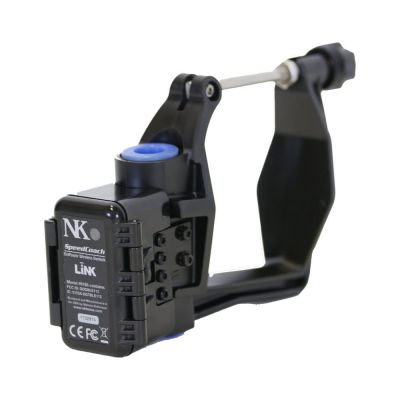
In cycling, power meters have been widely available for a relatively long time. When we are cooped up in our basements during long winters, rowers get accurate and simple power measurements from our ergs. But on the water, until recently, measuring power was a complex and expensive endeavor that required a cadre of trained technicians equipped with PhDs. That has started change, especially since the introduction of the EmPower oarlock from NK. It’s rugged, easy to use, and reliable.
With this tool, we can use power as a way to plan and execute workouts on the water, and the with the other data that the EmPower oarlock provides, we can gain insight into other aspects of the rowing stroke. We can measure things like slip at the catch and wash at the finish and even use this information live in the boat. When I started, one of the things I wanted to know was if my numbers looked right. I found this resource on the NK web page.
It confused me. My effective angles looked fine, but my power was lower than what they had listed for novice rowers. I mean I am but no means a speedster, but I am a middle of the pack master rower. I got very curious about why my numbers were low.
I’ve seen as more and more rowers have started to use the EmPower oarlock, I (and some friends of mine) started to become curious about the relationship between measured power and boat speed. On the erg, it’s a fixed relationship since pace is somewhat of a fictional concept on an erg anyway. But on the water, pace can be affected by a wide variety of things. Wind, current, boat type, rower weight, technique and even temperature. But the interesting thing is that if you account for those variations, the amount of power to move a standard racing single at a specific speed are governed by the laws of physics.
I decided to do an experiment to try to understand the relationship between power and pace better.
The Test Workout.
What we want is a plot of boat speed as a function of power. So what we need to do is row across a range of powers and record the speed. The best way to vary power in a consistent way is to vary stroke rate. We are interested in capturing data for well executed strokes, so we’ll keep each test run short enough so that fatigue doesn’t effect the results. Roughly a minute of rowing should do it.
Ideally, you would want to do the experiment with absolutely no wind and no current. Since that is hard to do, the experiment is designed to do trial runs in pairs, going in opposite directions. Even with this setup, trying to avoid windy days is wise.
So here is the procedure:
- Make sure the wind is light (<8km/h, 5 mph)
- Find a open stretch of water roughly perpendicular to the wind at least 500m long
- If there is a current, use an impeller for speed readings
- Repeat the following for stroke rate 18, 20, 22, 24, 26, 28, 30, 32 higher if you race at higher rates.
- At each stroke rate, take 5 strokes to get up to speed. Then one minute at the prescribed rate, then turn and repeat in the opposite direction.
- Try to minimize time in the middle of each set of 2 to avoid too much change in wind or other conditions.
- Take as much time as you like between sets to avoid accumulated fatigue.
- Capture the session using EmPower and Speedcoach GPS
- Data analysis in EmPower
Initial Trials
Our initial interest in this was to get an idea of the difference in speed between a standard racing shell and a Maas Aero. So, on successive weekends I did the experiment first on the Maas Aero and then on my Fluid. This is what the workouts look like in summary.
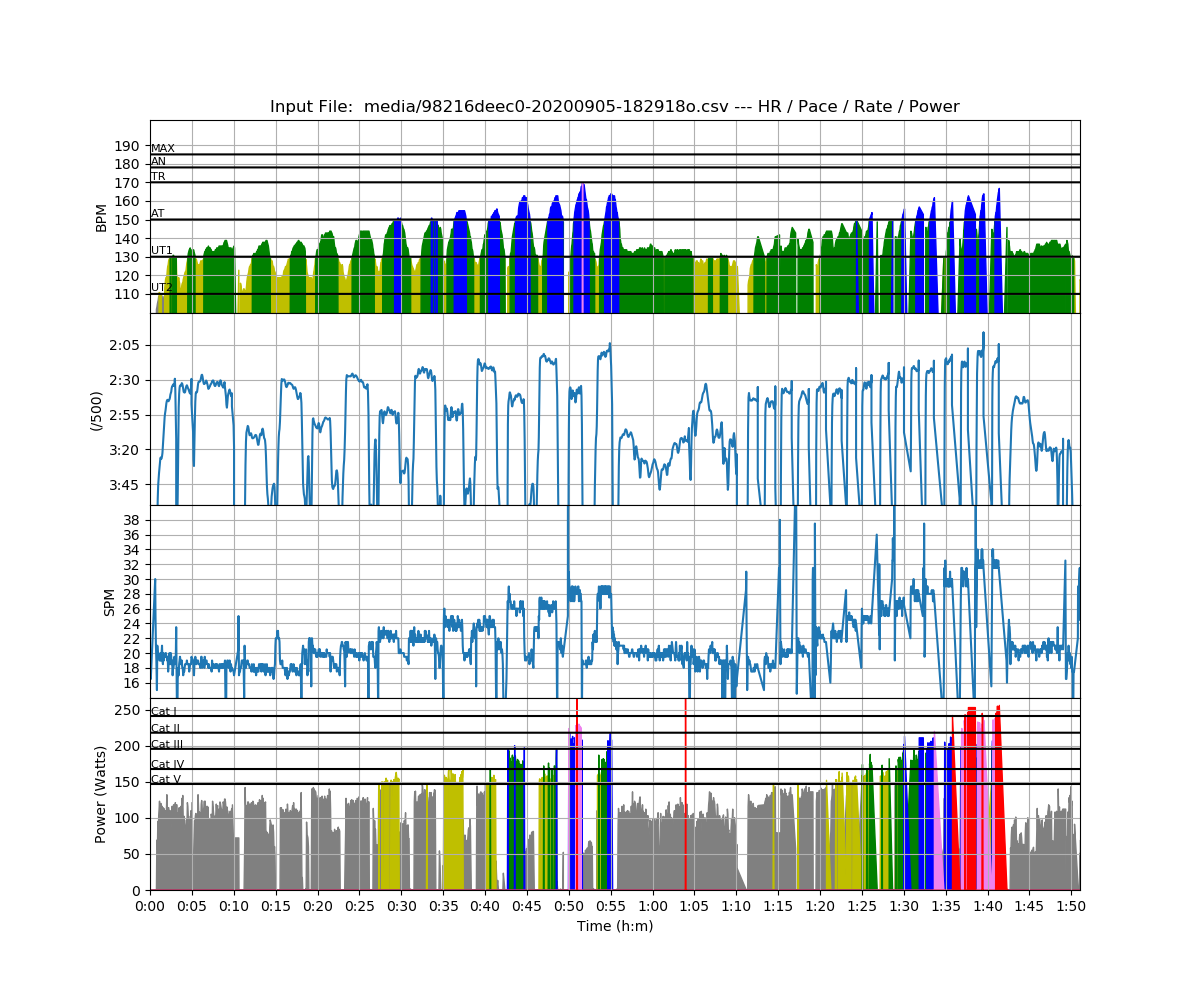
The session with the Maas, I was still developing the procedure. I went through the whole rate ladder and decided that there was too much wind and current where I was rowing to get good results. I also started out rowing 2 minute segments and I was getting pretty sloppy by the end of the pieces at higher rates. I rowed over to a protected cove and redid the whole set.
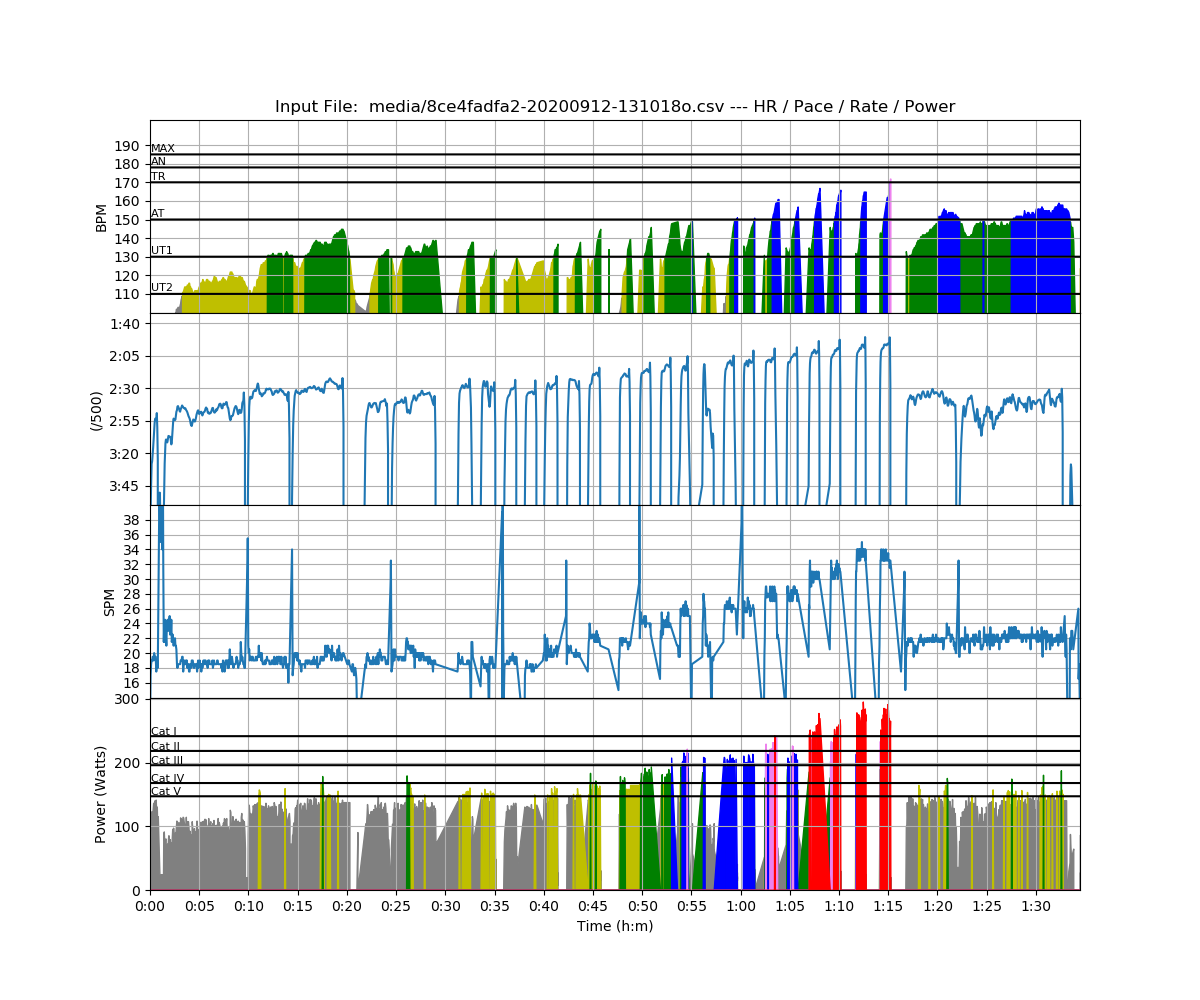
The session in the Fluid was a lot cleaner. I redid the segment pair at 18 spm because I decided I was rowing with higher than normal power. I also redid the segment pair at 22spm because I was waked in the first one.
Data Analysis
The primary data analysis is pretty simple.
- Isolate the one minute test segments
- determine the average boat speed and power for each 1 minute test segment
- average the results of the segment pairs (for each stroke rate tested)
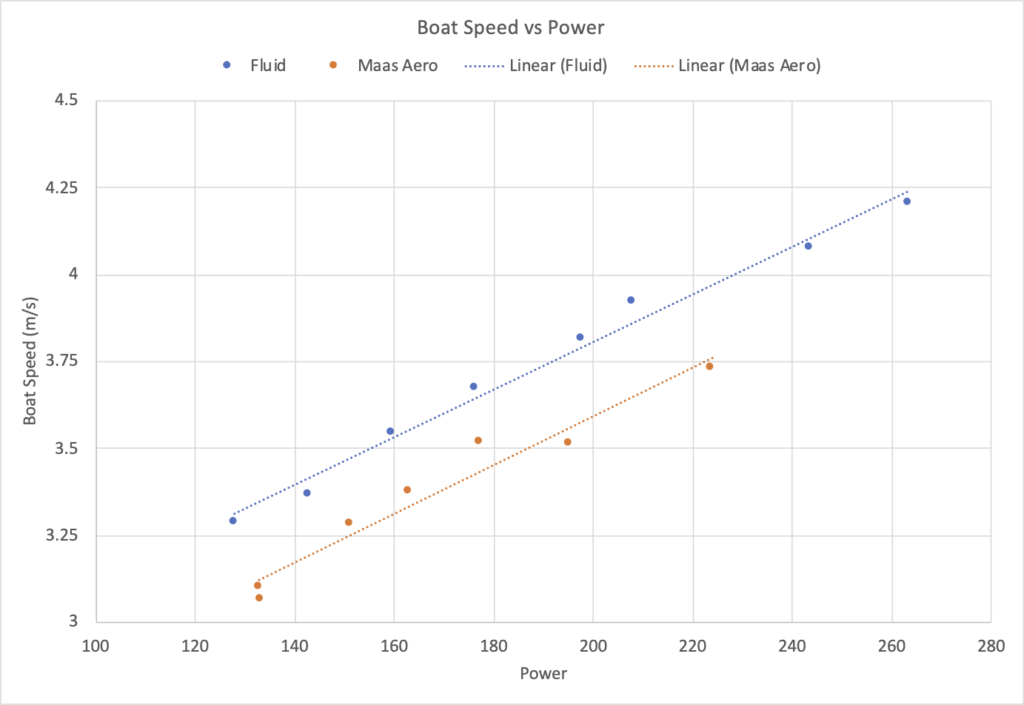
As you would expect, it takes more watts to move the Maas Aero than the Fluid. It’s a shorter, wider boat.
Now it’s your turn!
I am looking for interested volunteers to help me with a study.
What you need:
- A single (standard, coastal, whatever)
- Speedcoach GPS with Training pack
- Empower Oarlock
What you need to do:
- Repeat the experiment that I did. You can vary the progression of stroke rates if you like. It might be better to do 18,32,20,30,22,28,24,26. That way you get more of a break between the high rate pieces and do them earlier in the workout
- Send a CVS or FIT file from your workout to me at greg.smith.01748@gmail.com. In your email, please include:
- height
- weight
- gender
- age
- air temperature
- guess at the water temperature
- boat make, model and weight
- Any notes that are important about the workout, like “Ignore the 3rd rep, I got waked by a waterskier”
I will analyze the data and keep updating the results as I get contributions. I am hoping to develop a new version of the table presented on the NK site which includes pace references and a broader group of rowers.
Here are some of the insights that we will be able to get by building this dataset.
- The relationship between Power and Pace for rowers of different heights and weights
- An estimate of the accuracy of the empower oarlock from rower to rower
- correlations between stroke angles, force, power and speed for different groups of rowers.
Over the next few years, rowing with power is going to become more and more common and a bigger part of many rowing training plans. By helping with this study, you will be contributing to the development of the sport.
