
This is the first installment of a multipart series describing how you can use Rowsandall and the EmPower Oarlock to gain more insight into your rowing.
If you are one of those lucky people that live in a place where you can row on the water all year long, you might not be able to identify. I live near Boston, Massachusetts and every spring I feel like I’m starting over.
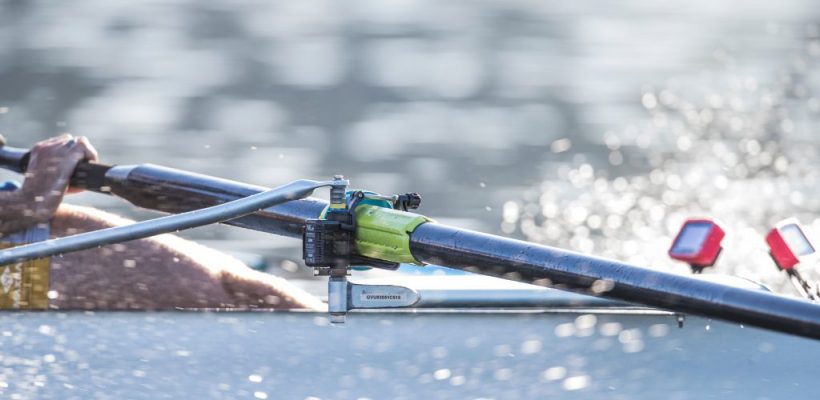
My first outings of the season are messy. I have no sense of balance, so I am constantly dragging my blades. I have so much back splash that I have to be careful to avoid getting a shower when I lift my boat out of the water at the end of a workout. In each stroke, I am likely to be going deep at the catch and washing out at the finish. My rowing is so inefficient that my heart rate will be through the roof, even though my pace is decidedly sub-aerobic.
And so the process of learning to row starts all over again. Of course, the most important part of that is spending time in the boat. But it’s easy to pick up, or perpetuate bad habits unless that practice time is mindful. That’s where the EmPower oarlock and Rowsandall come in.
A Little Background on Rowsandall
Rowsandall is an online platform for rowers. It is centered around an online logbook, which you can upload workout data to from a number of different platforms.

But Rowsandall is a lot more than just a logbook. It has five major capabilities
-
-
-
- Import / Export: You can easily get data from devices like NK SpeedCoach, smartphone apps like Boatcoach, or erg related apps like ergdata into Rowsandall. You can also easily import and export data from Rowsandall to and from other fitness platforms like Strava, Training Peaks and Sport Tracks
- Analysis: Analyze your workouts using graphical tools to gain insight into your performance and monitor your progress toward training goals
- Training Plans: Plan your training sessions and monitor how well you are implementing your planned sessions
- Competition: Race against other rowers both on the water and on the erg. This is similar to Strava Segments. Users can plan competitions and users can upload entries which are ranked. Participants can go and check out other racers entries to understand tactics and strategy.
- Coaching: Rowsandall is a great way for local or remote coaches to communicate training plans and review training results. It also enables athletes to submit test results online and enables coaches to compare athlete performance. The platform includes the ability to comment on workouts to enable direct feedback between coaches and athletes on each session.
-
-
Rowsandall offer basic functionality for free. A Pro membership enables additional capabilities (like support for EmPower data) for 25 Euros a year (pricing at time of writing, March 2019). Coaching functionality is a paid subscription and varies by team size.
Rowsandall has over 2000 active users and over 50000 workouts have been logged so far.
To learn more about Rowsandall, head over to the website.
For more on the EmPower Oarlock, skate on over to the NK website.
EmPower and Rowsandall really are an ideal combination. The EmPower oarlock with the SpeedCoach GPS provides a fantastic tool to use in the boat. Using the skill screens you can focus on many technical elements of the rowing stroke. You get stroke by stroke feedback in real time so you can set and practice against specific goals. But how do you figure out what to work on, set your improvement goals and how do you measure progress against them. That’s where Rowsandall comes in.
To make all of this work, you do need to part with a little more money. In order to get access to the data that the SpeedCoach saves, you need to spring for the “Training Pack” option for the SpeedCoach ($50 as of March 2019), and a “Pro” level subscription to Rowsandall (25 Euros a year as of March 2019). For anyone who has already plunked down $400 bucks for a SpeedCoach, and $650 for an EmPower oarlock, this small additional investment increases the value of what you have enormously.
SpeedCoach and EmPower gives you a great tool to use in the boat. Combining it with Rowsandall lets you use put the data that your SpeedCoach and EmPower oarlock are generating to work to help you measure your improvement and guide your training.
What gets measured?
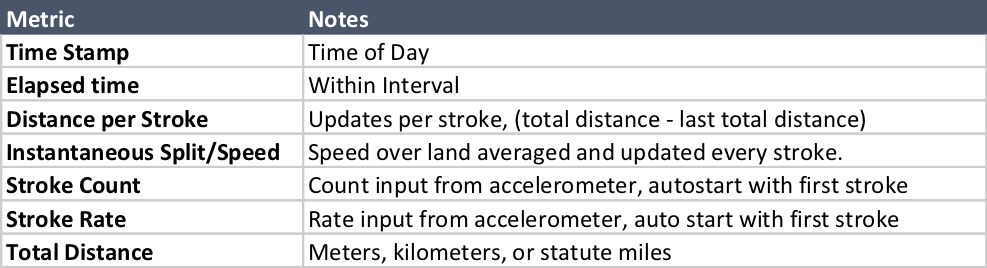
The basic SpeedCoach provides this data. (The following tables are from the NK website, and just reformatted to fit the screen a bit more easily)
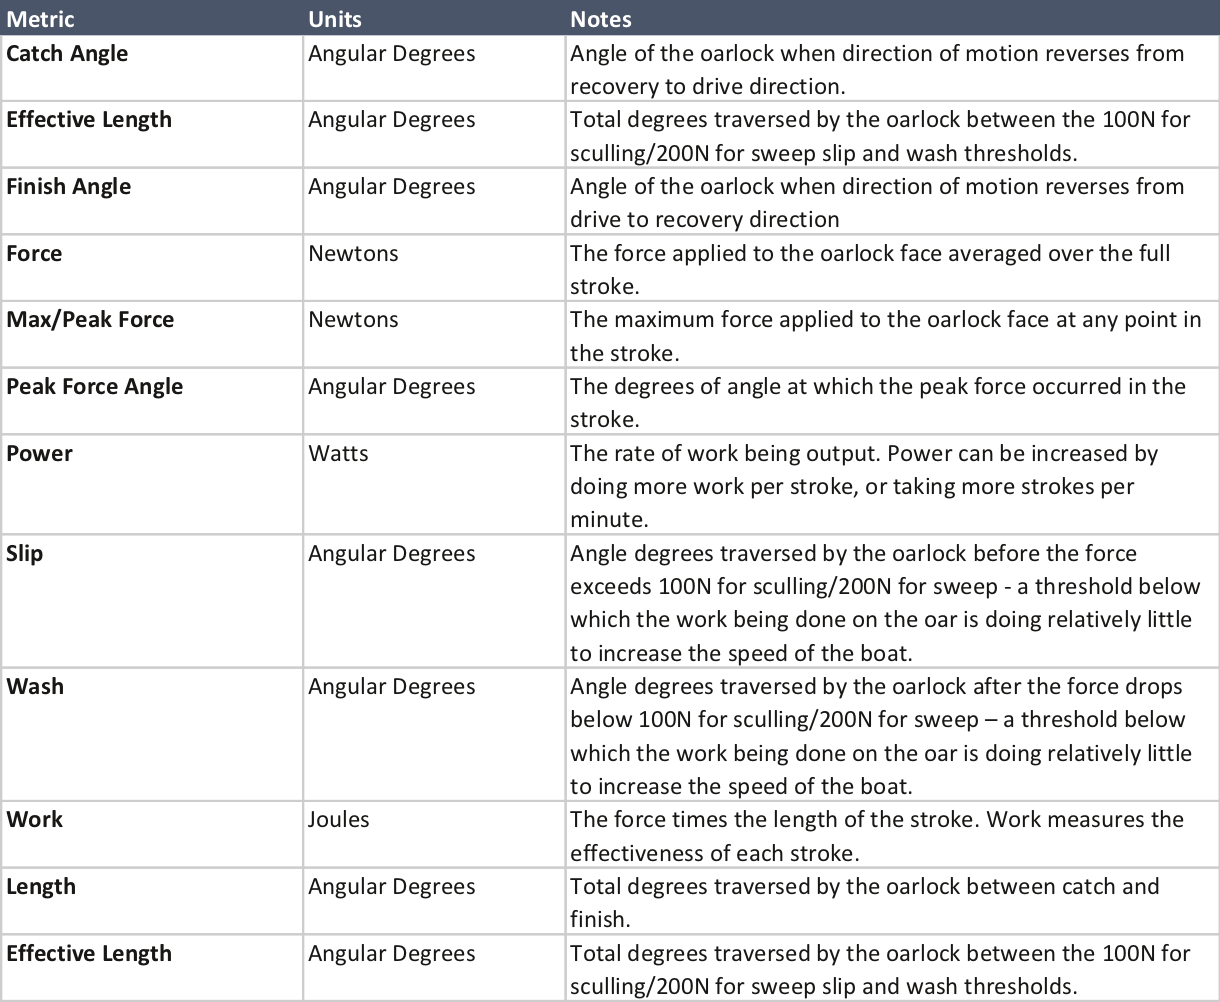
When you add the EmPower Oarlock, you get these additional measurements.
The way you get this information straight from the SpeedCoach is in the form of a “Comma Separated Value” file or a “.csv”. This is a file that excel can read and when you open it, it looks like this…
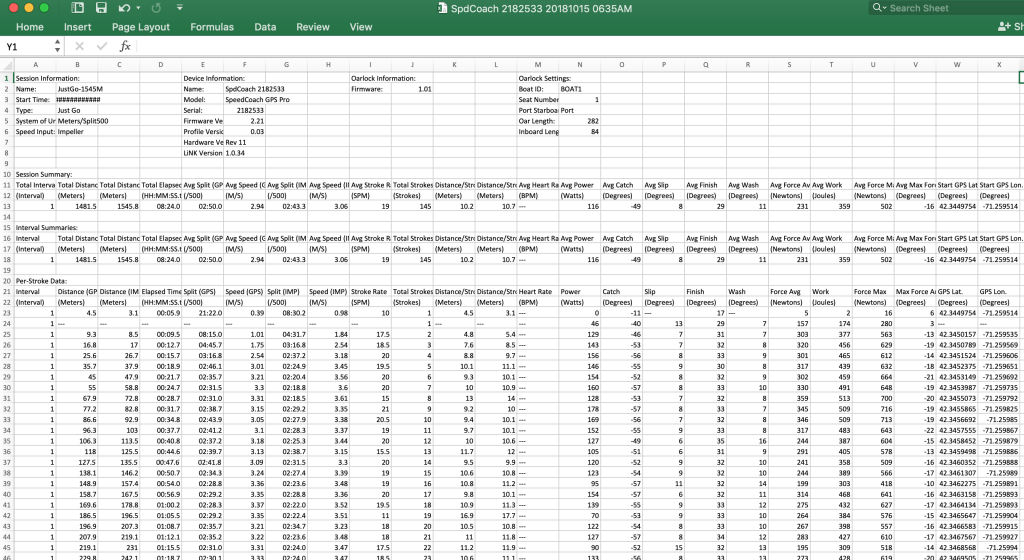
Now for the truly hardcore, you can dive into this file and use excel to make graphs. But seriously, is that any way to live? Do you really want to be that guy? (He says, knowing that he was, literally, that guy)
With Rowsandall, you don’t have to worry about .CSVs, or how to plot in excel, because Rowsandall understands EmPower data and helps you do actually use it to get faster.
What is good rowing?
An incredible amount of time and energy has been spent by rowers and coaches around the world to figure out how to row fast. If you have a good coach, they can drive a launch along next to you and provide real time feedback to help you modify your technique. They can tell you to stop doing things that slow you down, and let you know when you are doing things that help you go fast. But even if you have a coach, they can’t watch you all the time. And it is incredibly hard to keep all the elements of good form in mind as you row. It is so easy to fall back into bad habits.
The great thing about EmPower is that it can provide you consistent feedback, and is much less effected by wind and water conditions than working off of just pace, heart rate or “feel”. You can measure what “good” is and then adapt you training to move towards that ideal.
NK has published a very useful, and at least for me, a very depressing definition of what good is.
Representative Oarlock Values by Class and Skill Levels
It shows what you should hope to see for oarlock measurements broken down in sweep and scull, men and women, open weight and lightweight, and by different experience level. Here is an excerpt of the table for open weight men’s sculling.
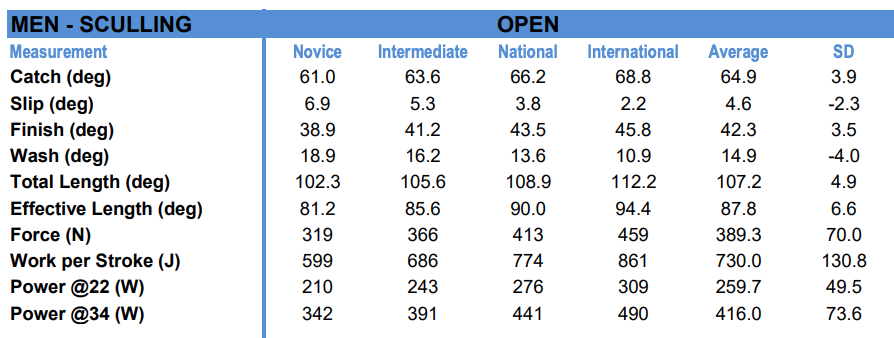
From comments that I have seen on line, I am not the only one who sees these to be somewhat aspirational numbers. Frankly, on some parameters, I am pretty solidly a novice after 5 years of rowing.
Of course, some of these numbers are very strongly tied to personally physiology. If you are taller, you will be able to row through a greater length. If you have a lot of muscle mass, you will be able to generate greater peak force. But, as a beginning guideline, it’s really handy to have.
In addition to this, Dr Valery Kleshnev has spent his career working on the biomechanics of rowing. He has a great book, not surprisingly called…
Which helps to define the terms and also provides some guidance about what “good” looks like. For example, the book includes this plot of target and actual oar parameters.
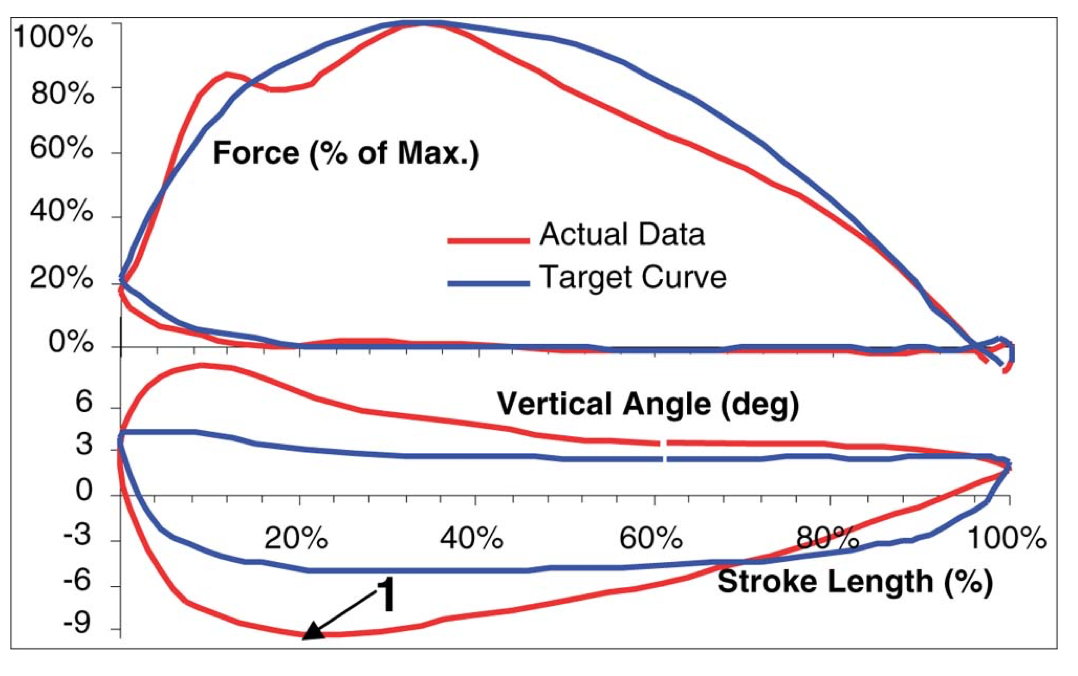
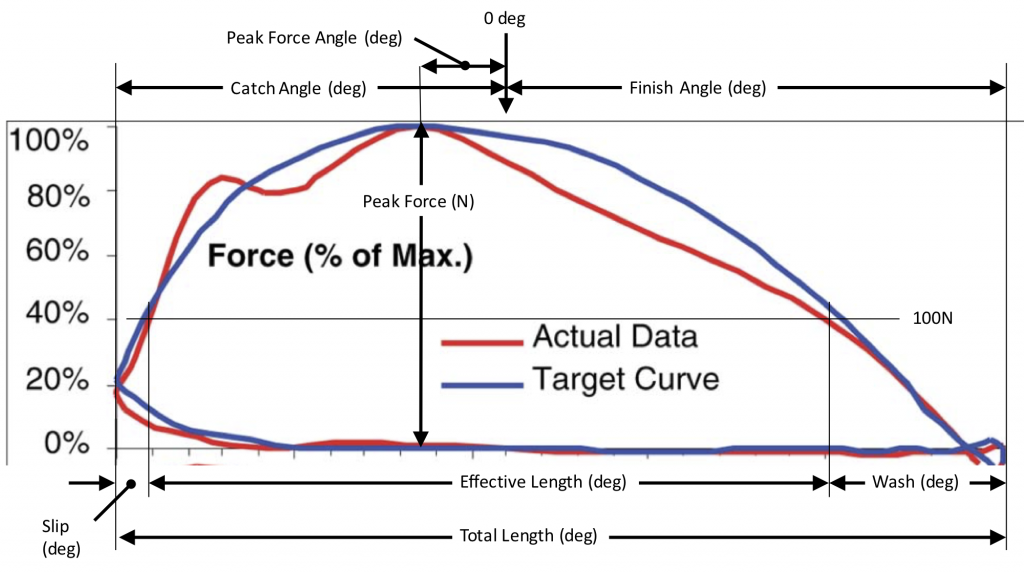
EmPower can’t provide all of the data in this plot. For example, it will not provide the oar vertical angle shown in the bottom plot. But the measurements that it provides can give you a very good idea of the force curve. I’ve annotated it below.
How can Rowsandall help?
To show some of the capabilities of Rowsandall, I’m going to use a workout I did last fall as an example. The workout was defined at 4 sets of 3 x 3′ intervals. The rest between 3′ pieces was 1′ and the rest between sets was 2 minutes. In shorthand notation: 4x(3×3’/1′)/2′.
If you are curious about that specific session, you can read about it here:
In Rowsandall, it’s easy to generate a summary plot to show what basically happened over the entire session.
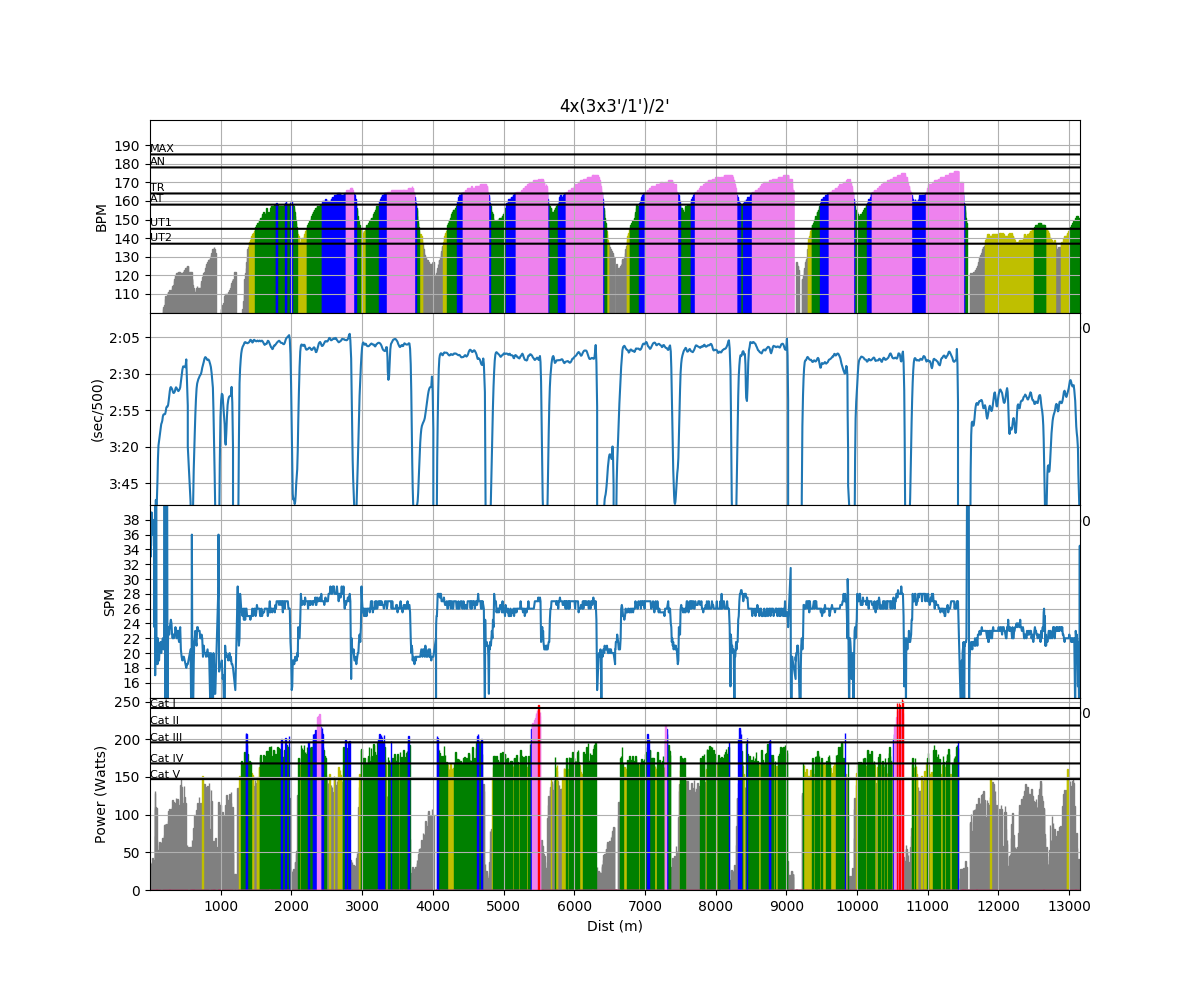
In the plot, heart rate is at the top, then boat speed (in time/500m), then stroke rate, with power from the EmPower oarlock at the bottom. The summary plot shows some of the challenges of analyzing rowing data. For any on the water session, real rowing data is messy. There’s a warm-up and cool-down. The 2′ rests are a bit sloppy because I needed to turn the boat. The pace is different between sets because I am either running into or with the wind, and even the power data has weird peaks and dips. That comes from going around curves in my bendy little river.
If I want to get insights out of this data, I need a way to deal with all of those confounding factors.
Intervals
The first challenge is to get rid of all the strokes in the workout that are not meaningful. I only care about the strokes that I took in the twelve 3′ intervals. I don’t care about the strokes that I took when I was warming up, or the strokes between the intervals or the strokes in my cool-down.
Since Rowsandall was designed by rowers, there is a quick and simple tool to let me identify and isolate intervals. All I need to do is plug in a pace or power level, and it will consider everything above that to be “work” and everything below that to be “rest”. The analysis tools on Rowsandall understand the concept of work and rest so you can make valid conclusions about your sessions. In this case, I defined a slice level at a pace of 2:25/500m, and Rowsandall neatly sliced my workout into these intervals
       Workout Summary - media/20181003-1200300o.csv
--|Total|-Total-|--Avg--|-Avg-|Avg-|-Avg-|-Max-|-Avg
--|Dist-|-Time--|-Pace--|-Pwr-|SPM-|-HR--|-HR--|-DPS
--|13144|74:02.0|02:49.0|117.4|24.2|148.7|176.0|07.3
W-|08088|36:08.0|02:14.1|169.3|26.3|160.9|176.0|08.5
R-|05066|37:55.0|03:44.6|067.9|22.2|137.0|176.0|06.5
Workout Details
#-|SDist|-Split-|-SPace-|-Pwr-|SPM-|AvgHR|MaxHR|DPS-
01|00112|00:31.9|02:21.8|125.3|19.0|125.5|130.0|11.1
02|00712|03:02.8|02:08.3|169.4|25.9|146.6|160.0|09.0
03|00729|03:08.1|02:09.0|171.2|27.1|157.1|167.0|08.6
04|00704|03:02.4|02:09.5|175.5|26.3|159.3|167.0|08.8
05|00629|02:52.6|02:17.2|171.4|26.7|158.0|169.0|08.2
06|00648|02:57.0|02:16.6|182.0|26.1|162.8|172.0|08.4
07|00632|02:55.0|02:18.4|163.2|26.7|166.5|174.0|08.1
08|00709|03:06.2|02:11.3|170.4|26.1|158.7|171.0|08.8
09|00694|03:02.8|02:11.7|158.8|26.3|167.3|174.0|08.7
10|00673|02:57.0|02:11.5|173.0|26.0|167.7|174.0|08.8
11|00597|02:47.0|02:20.0|164.4|26.2|157.9|171.0|08.2
12|00630|02:53.7|02:17.8|181.1|26.9|166.4|175.0|08.1
13|00617|02:52.0|02:19.3|159.1|26.8|169.2|176.0|08.0
You can see a short 112m burst in my warm-up, and then the 12 intervals. Pretty cool, huh? If you want to know more about that, check out this article:
The Flex Chart
Using a tool in Rowsandall called the Flex Chart, you can easily look at all the data saved by the SpeedCoach. Let’s start with something basic to illustrate one of the best reasons to use an EmPower oarlock. Let’s use the flex chart to show both boat speed and power.
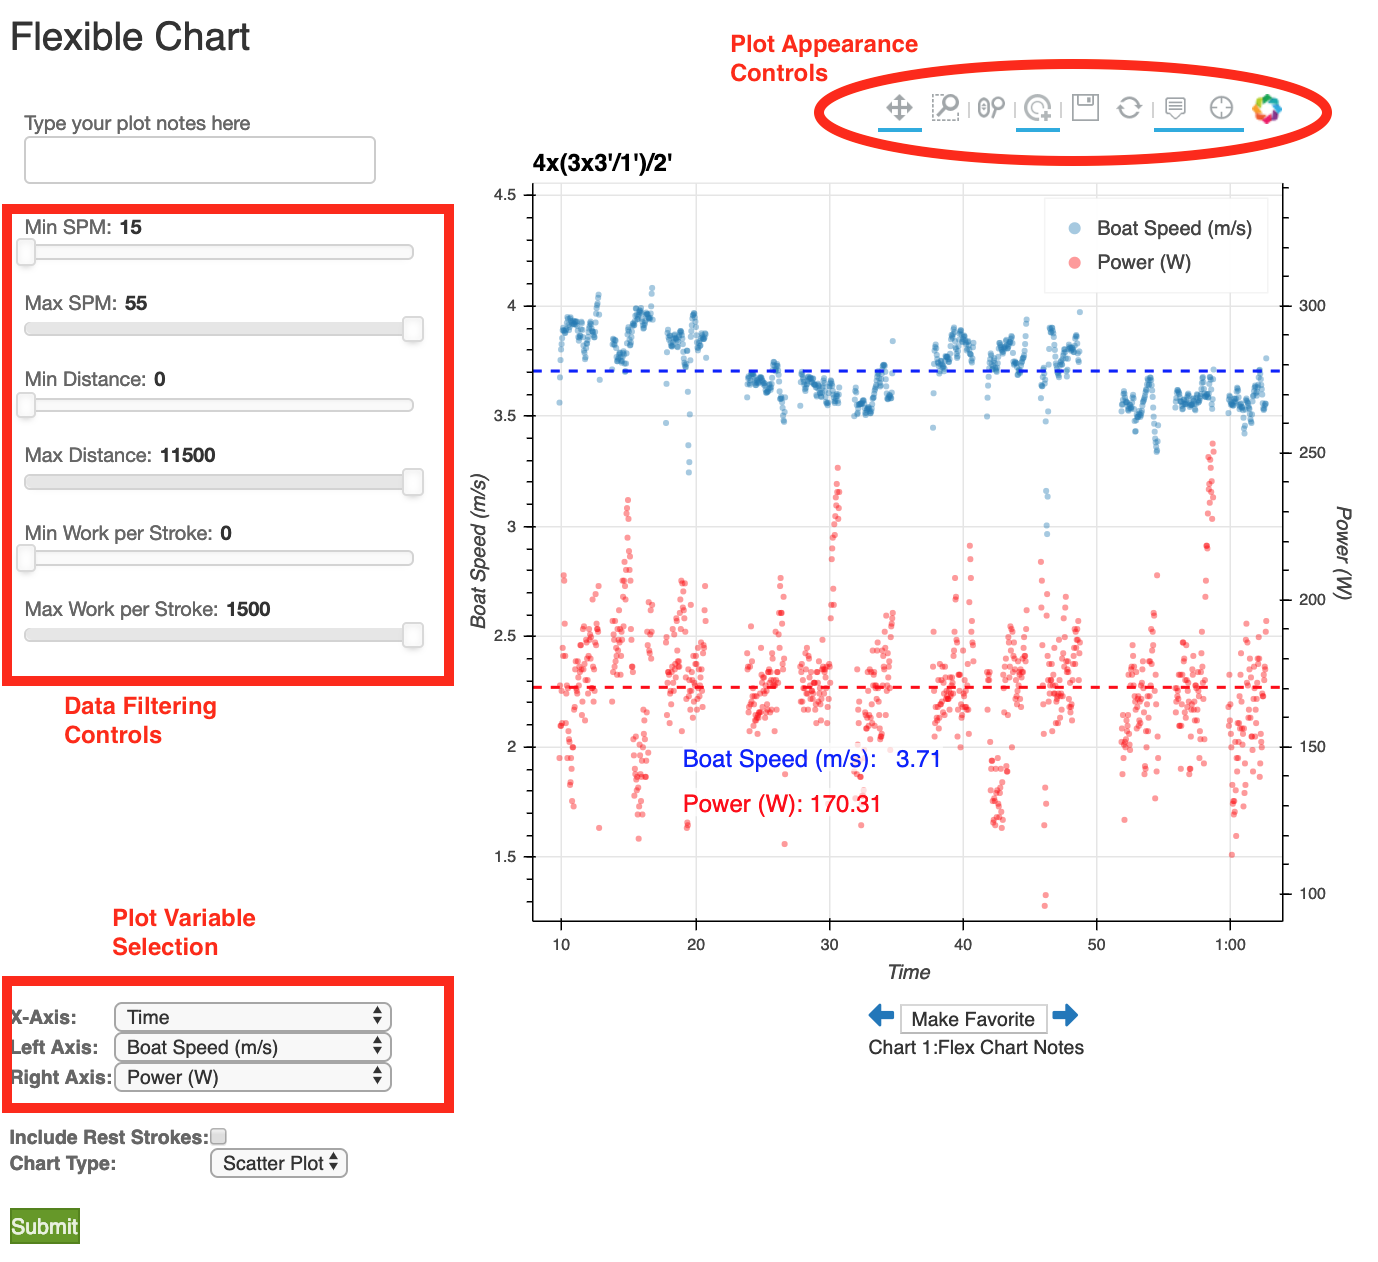
So, there’s a lot going on here. Let’s take it step by step.
Down in the lower left is where you select the data that you want to plot. It’s a pretty extensive list.

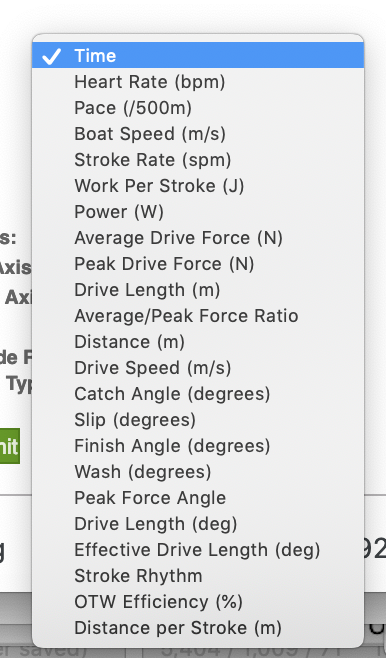
Unlike most other analysis tools like Training Peaks and Strava, you have a LOT of choices about what to plot. Another big difference is that those tools generally let you look at stuff with either time or distance on the x-axis. Rowsandall let’s you choose basically any variable for the x-axis. This is critical for a technical sport like rowing, and I’ll show you a use for it in a little bit.
On the plot you can see the two variables selected, and the average value for these variables.
Under the variable pickers there is a check box to let you plot all the data, or exclude the rest strokes. Want to know what your average power was for all your work intervals? Easy, just plot power as a variable and exclude the rest strokes and it’s right there on the screen.
You can also change the plot format from scatter plot to a line plot. I tend to like the scatter plots better, but that’s a matter of personal preference.
Above that are a set of sliders that allow you to filter the data and watch the plot change in real time. Also, the average values change so they are correct for just the plotted points.
Last thing are the little icons above the plot. These let you zoom and pan the plots without changing the data that is plotted. And for me, the all important “save” button, so I can capture the plot and put it in my training journal.
This specific plot is a pretty good illustration of why training with power is a great thing for rowing. If you are trying to implement a training plan, generally you are trying to achieve a specific intensity in each workout. There are a bunch of ways that rowers do this.
- Feel: This is usually described in terms of pressure: paddle, firm, race, all out
- HR: Usually defined by particular training zones
- RPE: Self evaluated perception of the exertion
- Stroke rate: Since rowing at higher rates is faster but more taxing
- Pace: If you have a SpeedCoach, other meter or a rowing app, you can use pace targets, usually relative to the pace for a threshold test, or a 1K or 2K time trial.
These methods are useful, but have disadvantages. A similar situation existed in cycling, and the sport was transformed by the introduction of practical and accurate power meters. The same thing is true of rowing. By using a power meter, you can prescribe intensities and row to them independent of conditions.
This workout shows how consistent power can be, even when conditions are causing a variation in boat speed.
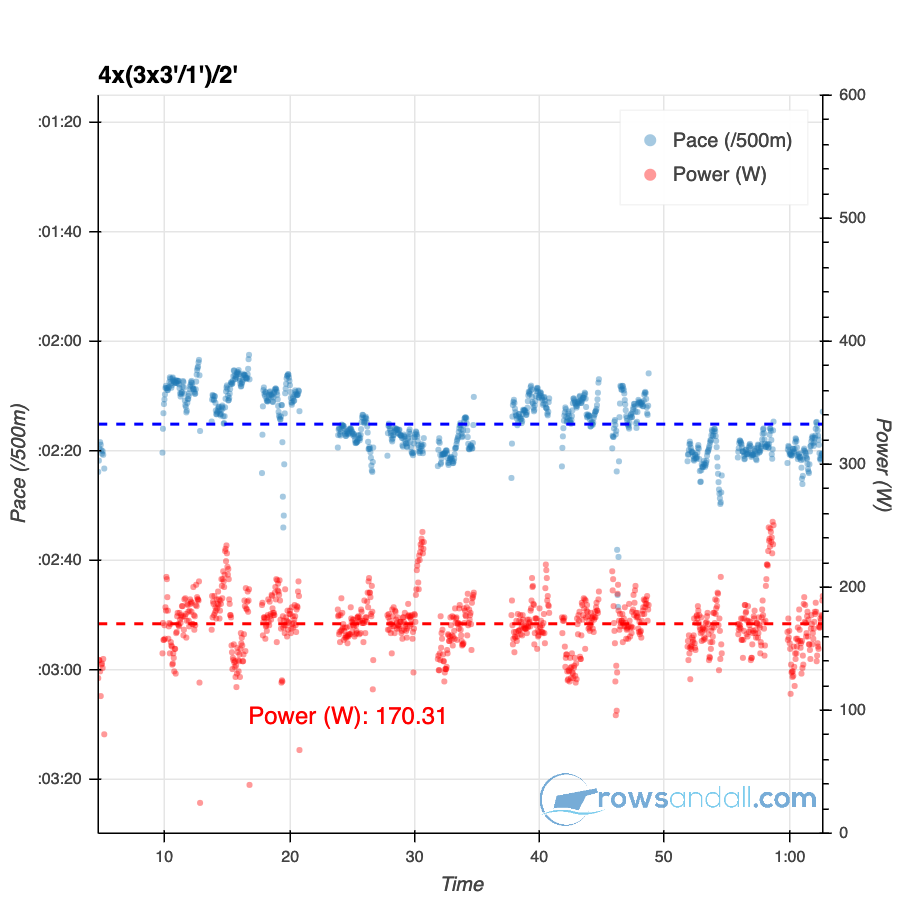
In this workout, my pace was around 2:10 going downstream, and 2:20 going upstream. But you can see that the average power was a lot more consistent.
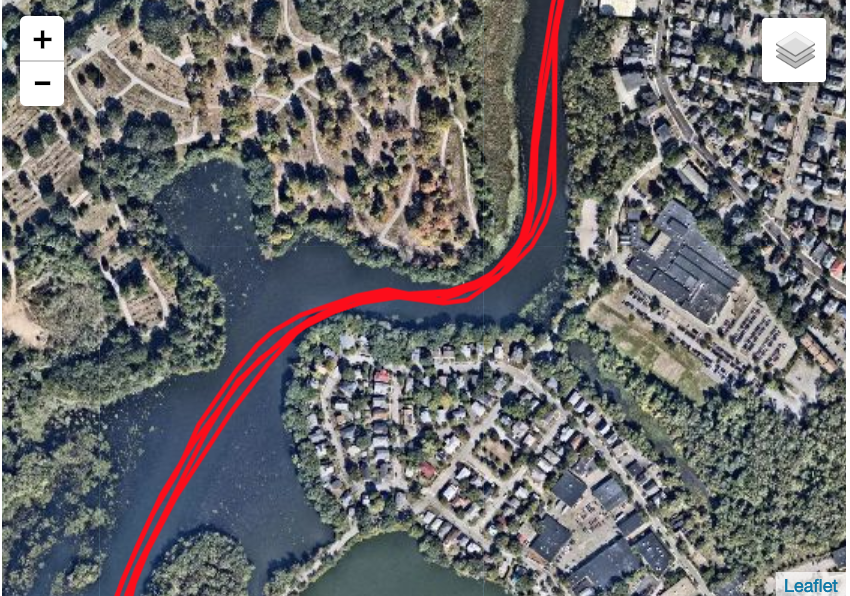
You can also see one challenge with using power in a boat right now. Turns. Since the EmPower oarlock goes on one side of the boat, the power measurement is effected when you have different pressure between port and starboard. Take a look in the green oval. That is showing the power as I go around a bend in my river.
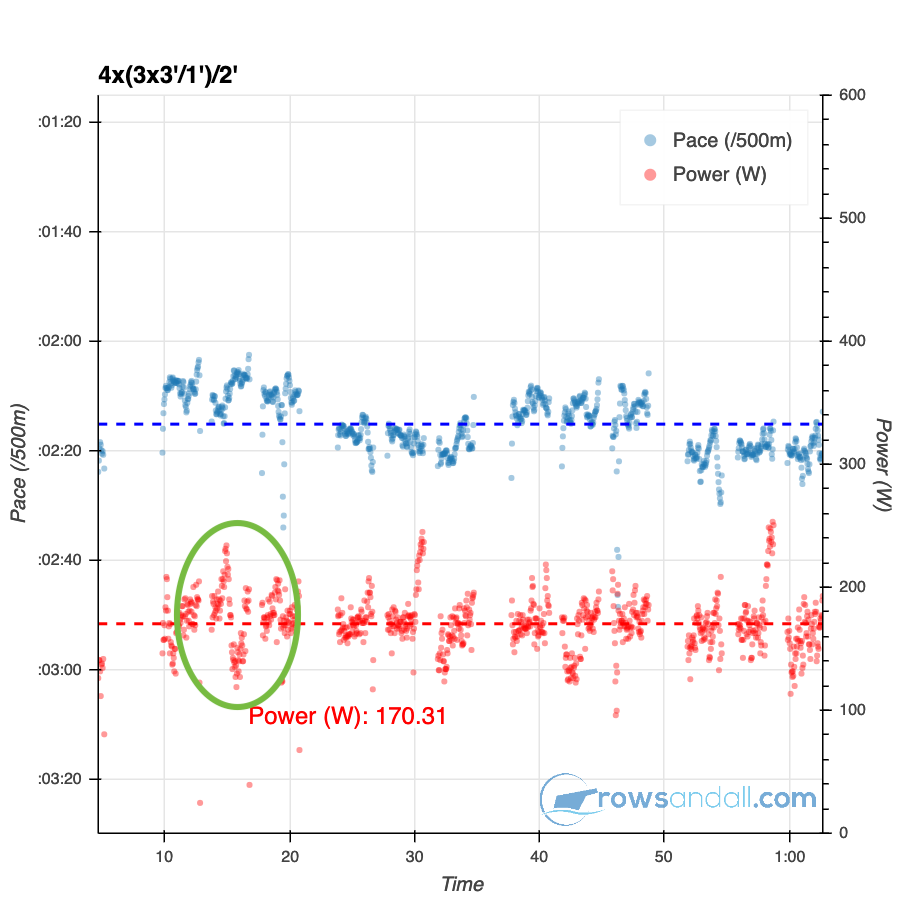
Here it in the map view (also from Rowsandall). I have the oarlock on my port oar, so as I go into the curve, going from the bottom of the map toward the top, I am putting extra pressure on port, then I switch over to put more pressure on starboard, and the power measurements drop way down.
We can use the flex plot to explore how we did in this workout. If I want to see if I am maintaining my technique as I get tired, I could look at the effective length of my stroke.
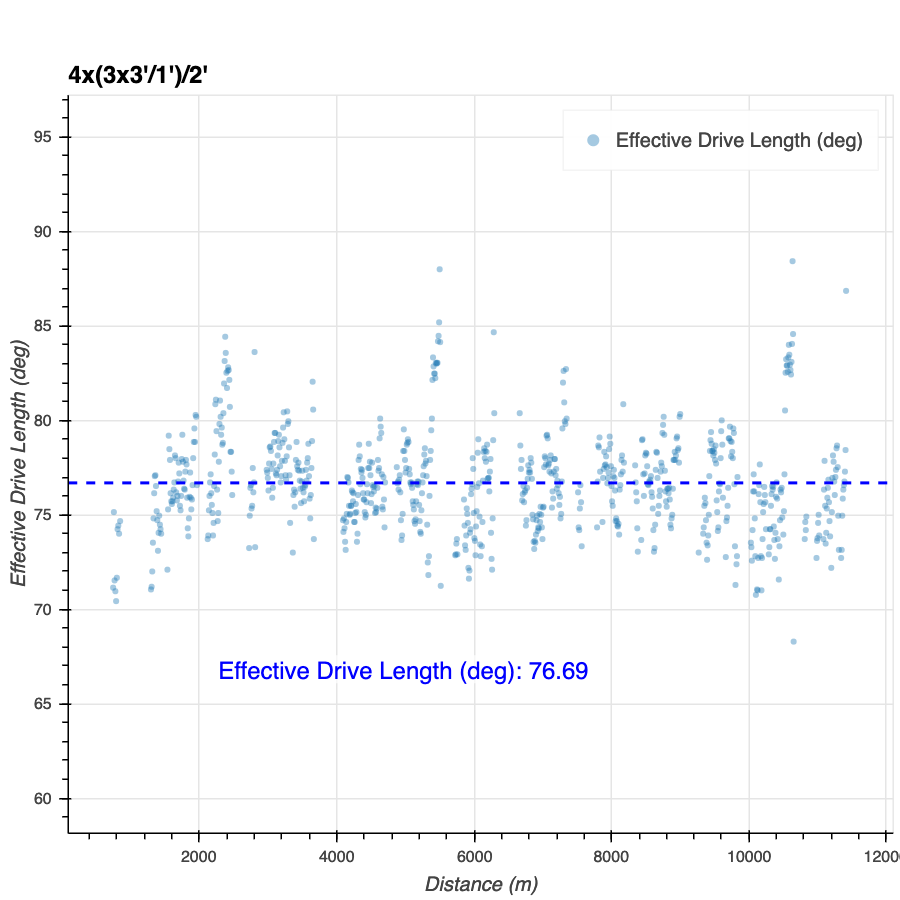
There might be a slight decline over the workout, but it looks reasonable.
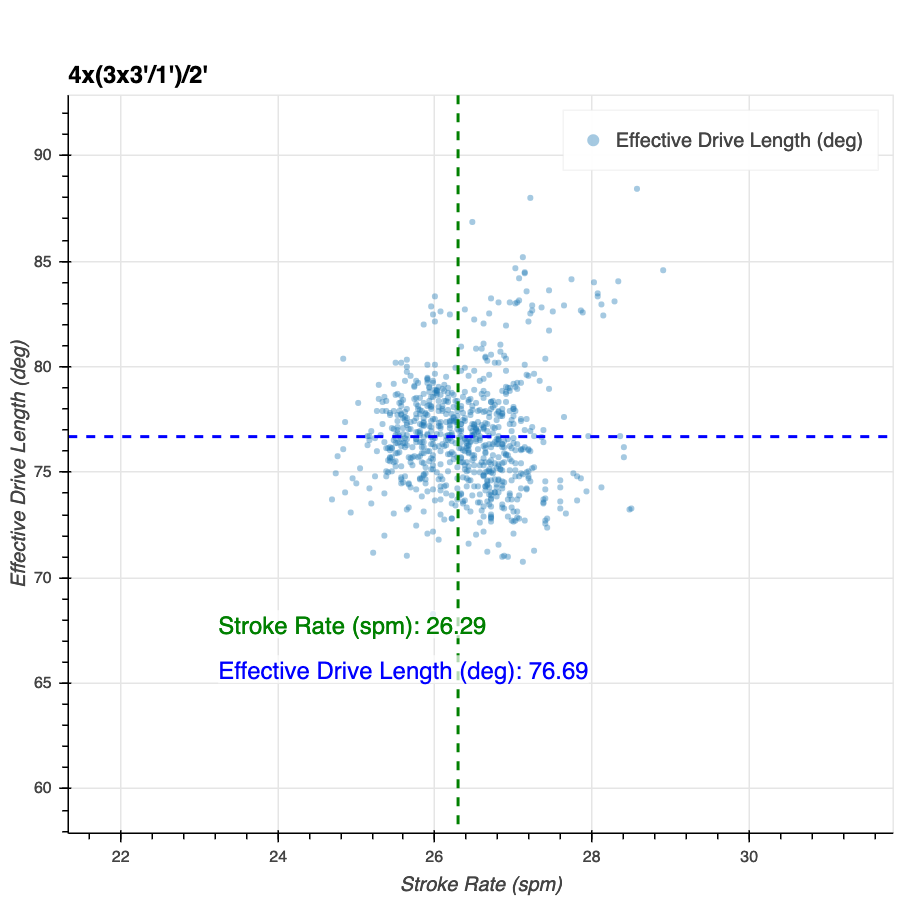
But we can use this tool to look at the same variable a different way. For example, is there a relationship between effective length and my stroke rate. I can go and select stroke rate for my x-axis, and bada-boom, I get an insight. At lower stroke rates, I have a reasonable consistent effective length, but as my stroke rate goes up, the range of my effective length increases. I can see from this plot, that my rowing becomes more erratic at higher rates
What’s your Force Curve?
The EmPower Oarlock does not record your complete force curve, but Rowsandall can use the data that EmPower provides to generate a simplified “Force Curve”.
In Rowsandall, you can go into the interactive force curve tool for any workout with EmPower data and you see a screen like this.
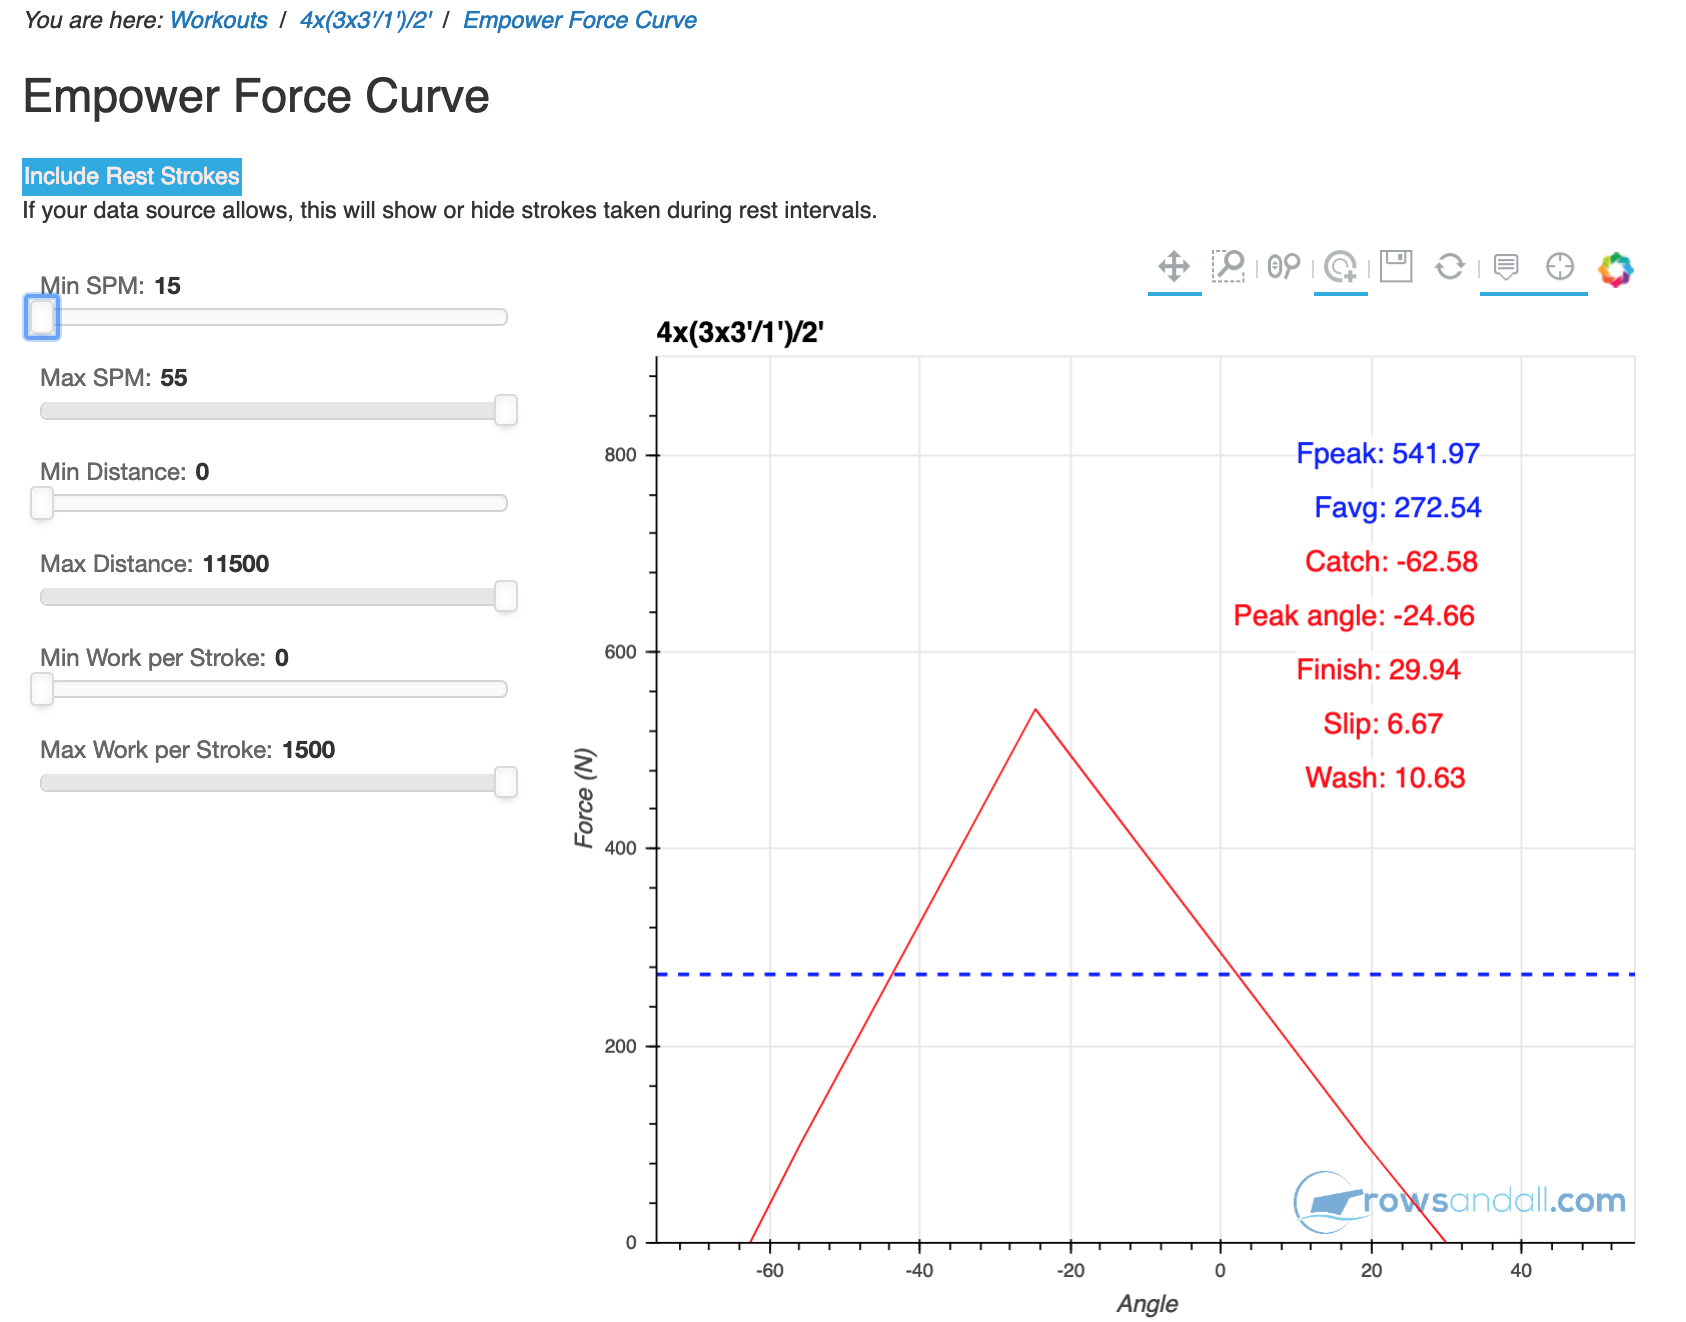
The plot itself shows graphically the total length, effective length, peak force, and peak force angle. It also shows average values for average force, catch angle, Peak force angle, finish angle, slip and wash.
But what makes it a really powerful analysis tool is the control panel over on the left side of the screen.
Starting at the top, by clicking on the blue button “Include rest strokes”, you have the ability to toggle between looking at all strokes, or just the “work” strokes. The next set of controls allows you to only look at your force profile over a restricted range of stroke rates.
Let’s try that out on the example workout. What if I wanted to see how my force curve was changing with stroke rate? To do that, I just move the sliders and the chart automatically updates. Below you can see two force curves, one for strokes below 24spm, and the other for strokes above 24spm.
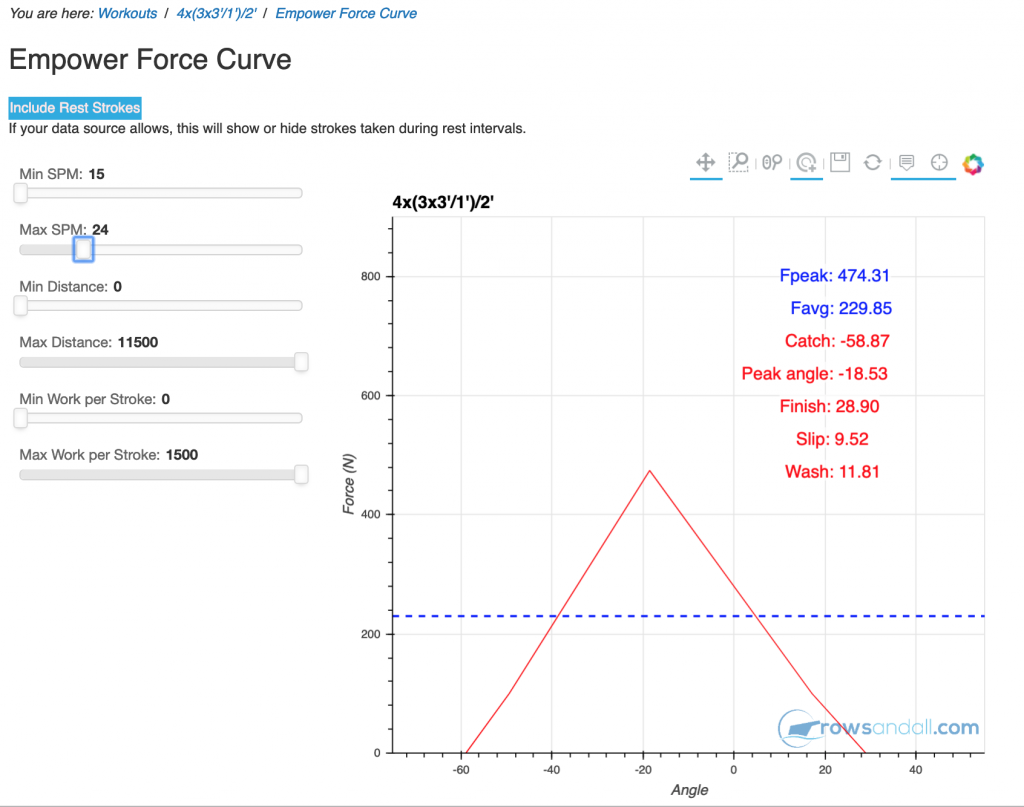
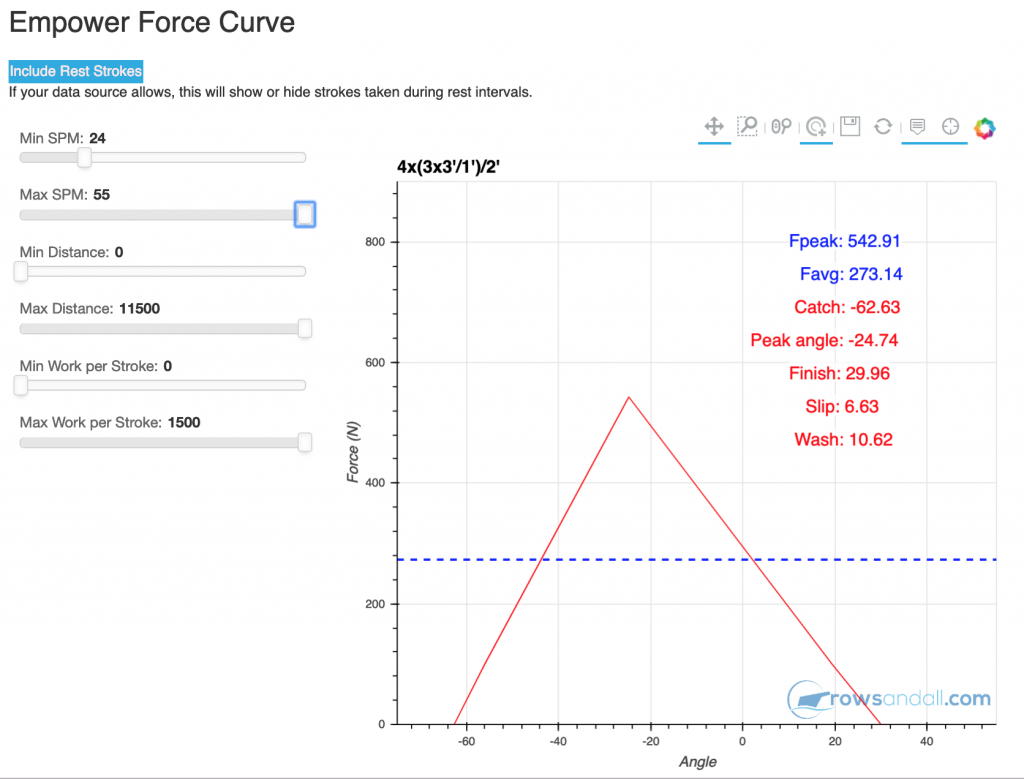
You can see that my strokes above 24spm have a greater catch angle, longer total length, better slip, better wash, and therefore my effective length was almost 10 degrees better. My peak force angle also moved toward the bow by 6 degrees.
So, from a technique perspective, my strokes above 24spm were better.
I could also look at the effect of fatigue on my technique. Let’s compare my first and last intervals, for this I use the distance sliders.
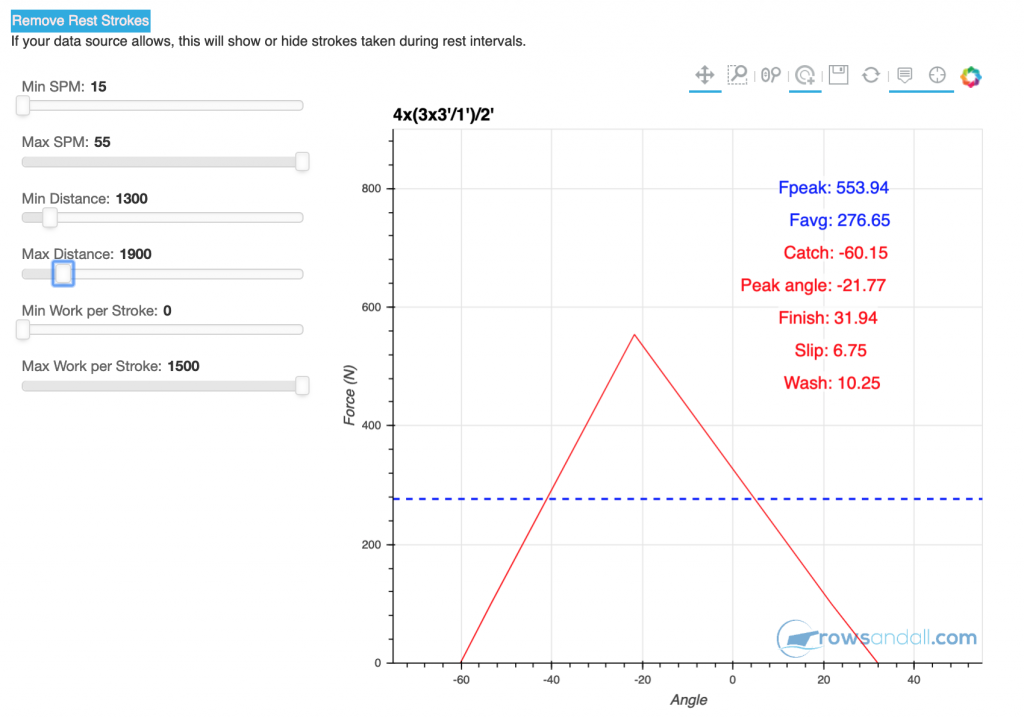
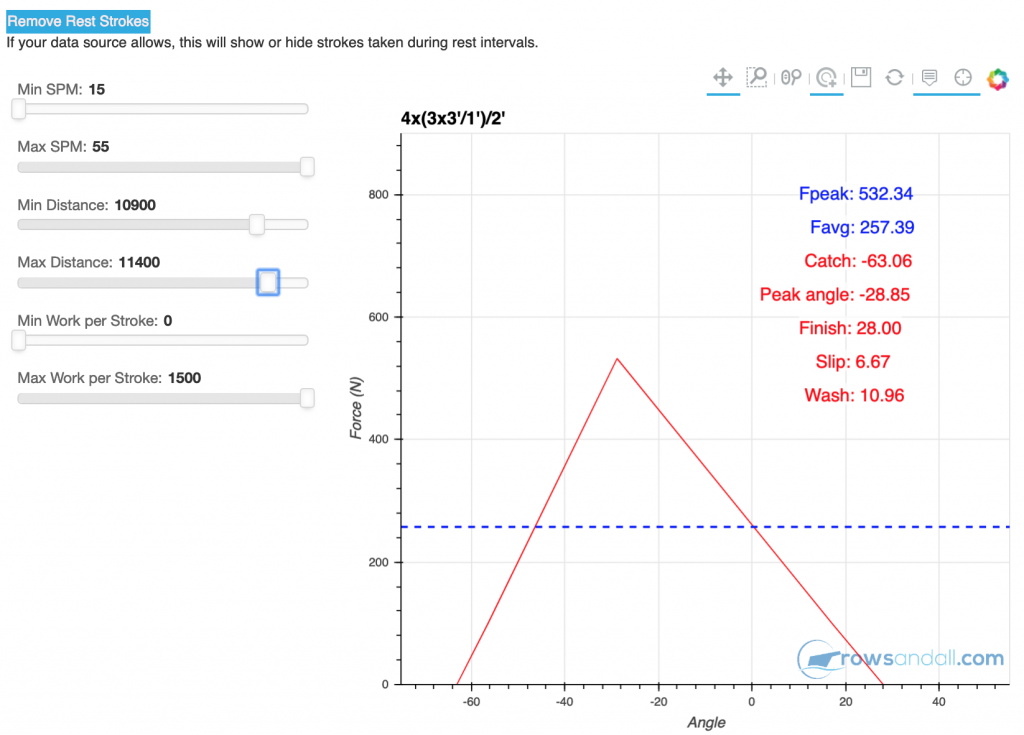
The thing I find interesting in this comparison is that my peak force angle is moving early in the stroke for the last interval. The peak force is lower.
In the next installment, I’ll show how you can use the analysis tools on Rowsandall to gain a deeper understanding of your rowing, and monitor progress in your training