
Introduction
In this post, I am showing how I personally use the functionality of rowsandall.com. This is not a manual, or a detailed explanation of the different tools you have to attack your workout data. It is just a collection of sessions, and I show and tell what I do, based on a number of workouts I did in the middle of March, 2018. Where I live, it was cold and dark, and there was no OTW rowing. So everything was done on the ergometer.
I hope this is useful for you.
Workout 1
This is a workout that I blogged about on my training blog on March 14. The description of this workout is:
- 4x(4min+3min+2min+1min)/2min at 20/22/24/26spm
Workout Summary - media/20180313-1925580o.csv

--|Total|-Total-|--Avg--|-Avg-|Avg-|-Avg-|-Max-|-Avg

--|Dist-|-Time--|-Pace--|-Pwr-|SPM-|-HR--|-HR--|-DPS

--|10856|48:00.0|02:12.6|174.5|20.5|156.9|176.0|11.0

W-|09994|40:00.0|02:00.1|202.5|22.1|157.7|176.0|11.3

R-|00871|08:00.0|04:35.7|034.6|12.7|153.2|176.0|24.1

Workout Details

#-|SDist|-Split-|-SPace-|-Pwr-|SPM-|AvgHR|MaxHR|DPS-

00|00968|04:00.0|02:04.0|180.5|20.2|133.7|146.0|12.0

01|00748|03:00.0|02:00.3|201.2|22.0|154.1|158.0|11.3

02|00514|02:00.0|01:56.6|220.4|23.5|159.9|164.0|10.9

03|00269|01:00.0|01:51.5|251.6|25.9|166.0|169.0|10.4

04|00965|04:00.0|02:04.3|183.3|20.5|145.1|155.0|11.8

05|00748|03:00.0|02:00.3|200.7|22.1|160.4|164.0|11.3

06|00516|02:00.0|01:56.2|222.7|23.9|169.2|172.0|10.8

07|00269|01:00.0|01:51.7|250.6|25.6|172.3|174.0|10.5

08|00966|04:00.0|02:04.2|183.2|20.3|151.0|162.0|11.9

09|00751|03:00.0|01:59.9|203.1|22.2|166.4|169.0|11.3

10|00515|02:00.0|01:56.5|220.9|23.8|171.4|172.0|10.8

11|00267|01:00.0|01:52.3|247.3|25.5|172.7|174.0|10.5

12|00966|04:00.0|02:04.2|182.5|20.3|152.0|167.0|11.9

13|00750|03:00.0|01:60.0|202.4|22.4|167.8|171.0|11.2

14|00516|02:00.0|01:56.3|222.1|24.3|173.3|176.0|10.6

15|00264|01:00.0|01:53.5|239.4|25.6|174.9|176.0|10.3
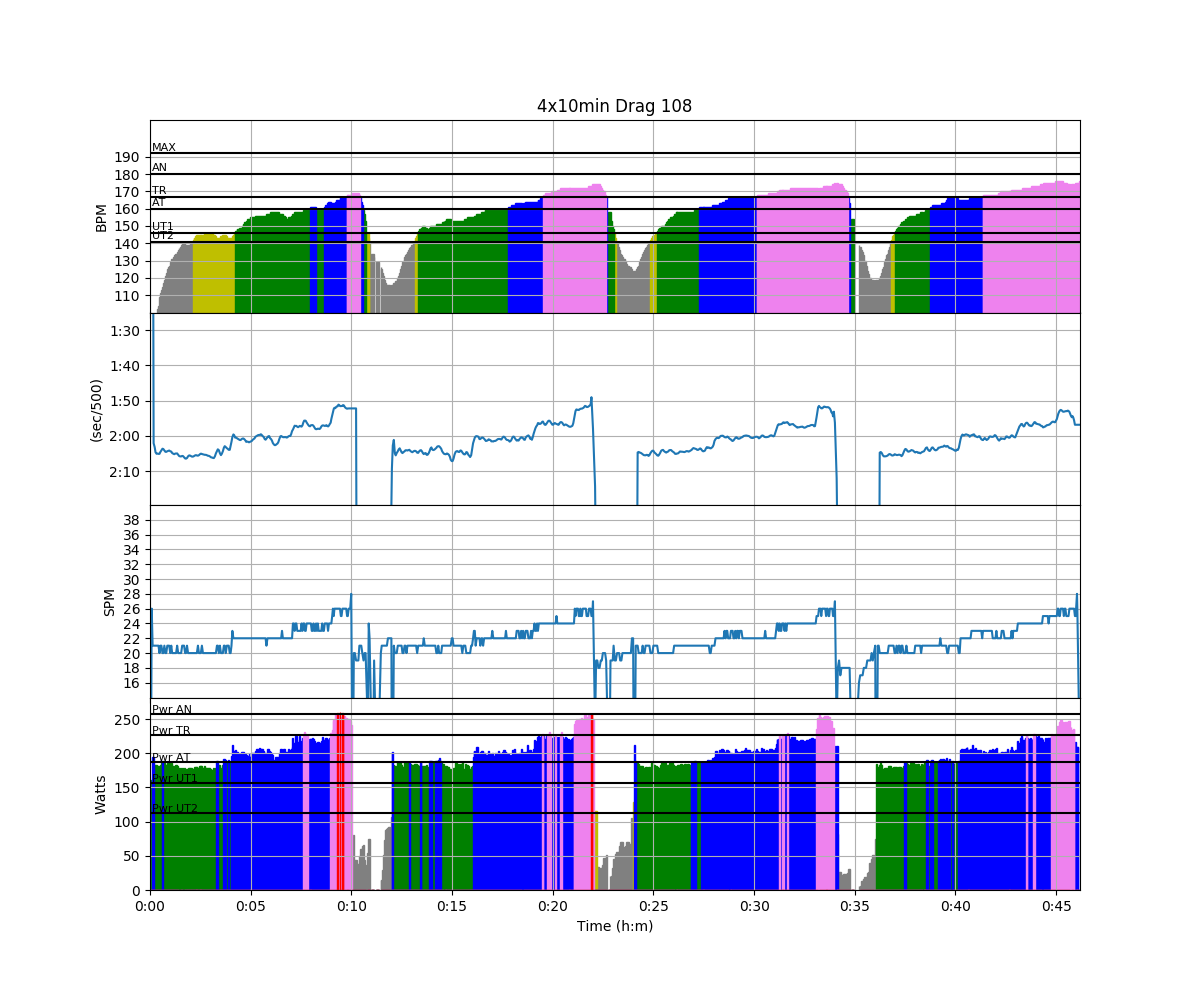
Looking at Work per Stroke is interesting:

Ideally, in these rate ladder sessions, you should row at constant Work per Stroke, but somehow I was increasing the work slightly at higher stroke rates. Should I have pushed harder at 20 spm?
On Tuesday, I took lots of screenshots to explain how I do the data on this workout. Here are the details. First, a picture of my erg basement:

No, that is not a very glamorous environment. It’s a small room in our basement. The black hole in the back is a door, which I open to let in fresh air. In the right corner, on the water pump box, you can see a Raspberry Pi. It is not in use at the moment. An abandoned project.
More important are the box close to the erg, with a radio/USB speaker combo, and the iPad.
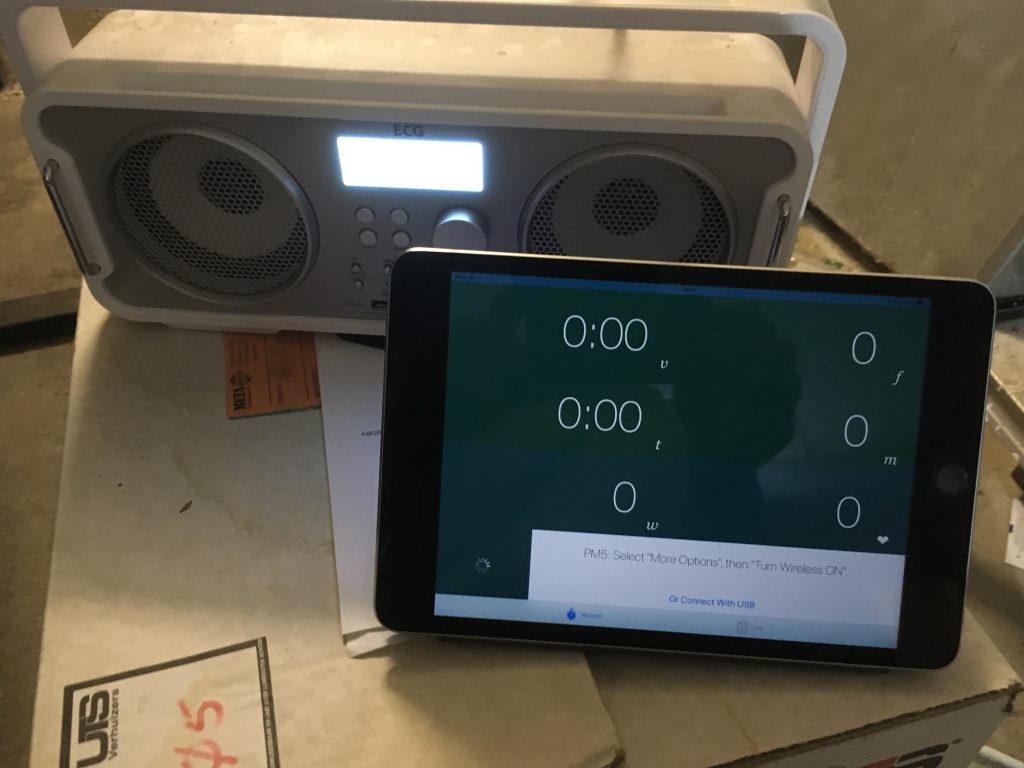
The iPad is running SoundCloud in the background with appropriate workout music which is coming out of the radio speakers through the BlueTooth connection. In the foreground, I am running Painsled, which is not yet connected to the PM5. Here’s a series of pictures showing me connecting the Polar OH1 and Painsled:
You need to repeat these steps at the start of each session.
Now you’re good to go. Start pulling and the iPad with Painsled will show a copy of your parameters. This picture taken during one of the rest periods:
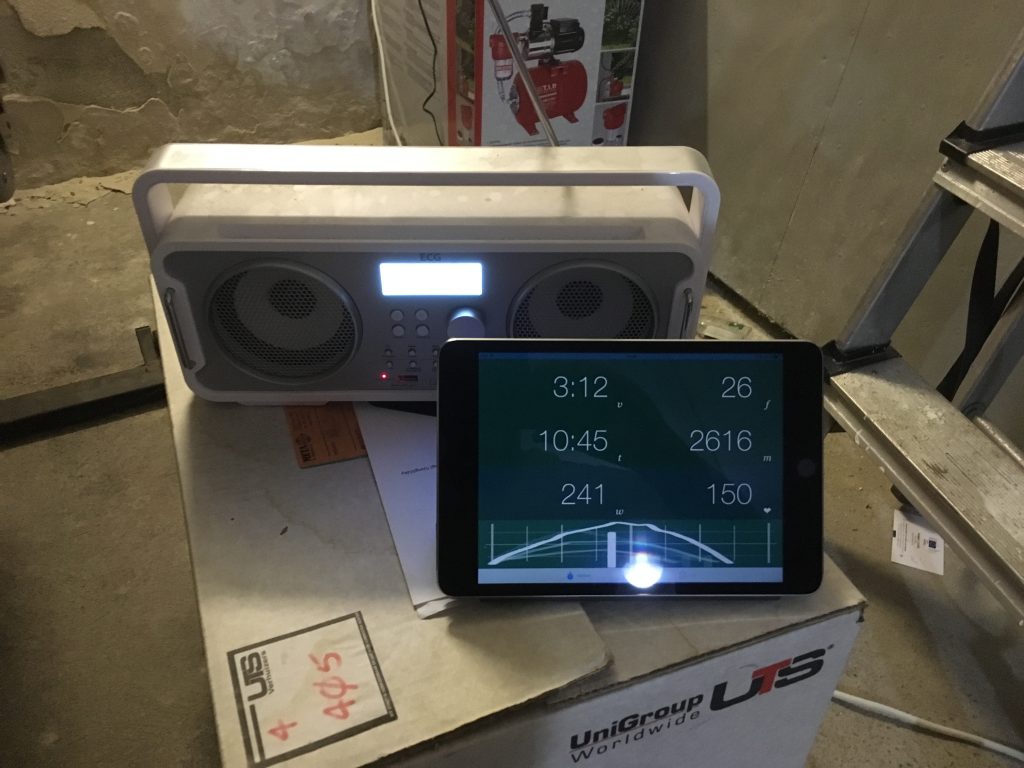
You can use the PM as normal. Each time you press the Menu button to start a new workout or Just Row, Painsled will save the data, but you can safely ignore this and just focus on the PM5.
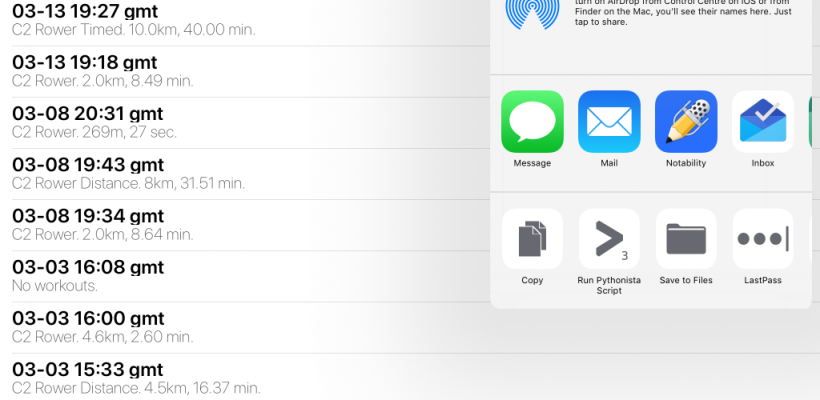
After the session, it is time to get the data out of Painsled and to Rowsandall, Concept2 logbook, SportTracks and other places.
There is one thing I forgot to screengrab. In Settings, you must select “CSV file” under the Painsled Export settings. When writing the email, notice that the From address is the one I use for my rowsandall.com account, that the email Subject will be copied as the workout name, and I use email commands to synchronize my data to the Concept2 logbook (“C2”) and SportTracks (“st”), and make a time chart. A few minutes later, I receive the following email:
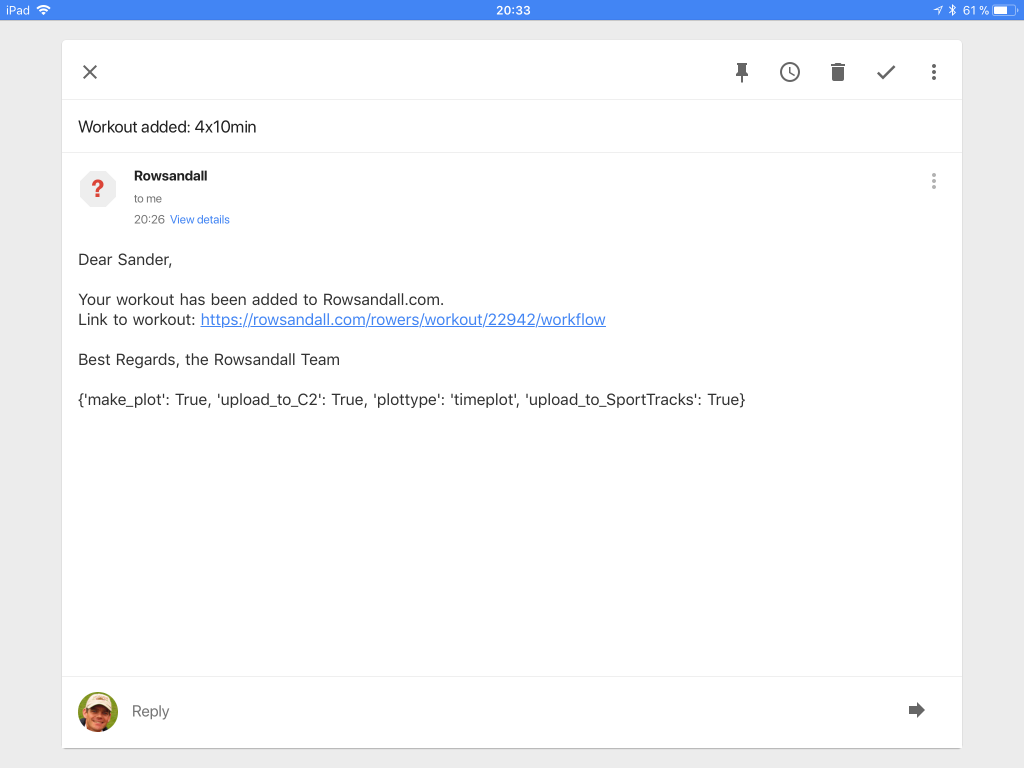
Now, I can start looking at the workout data on rowsandall.com. Here is what I look at.
For the swimming session of today, I use the Polar OH1 in standalone mode, and then sync it with the Polar Flow app after the swim. This will get the data on Strava, from where I can import them into Rowsandall.com. The only thing I do is link it to my planned session, and that’s it.
Workout 2
The Session
6x(1min+1min+1min+1min)/2min @ 22/24/26/28 spm
Interesting training session. It wasn’t too hard, but it was clearly in the threshold power range, and it was a good workout.
A nice and long summary:
Workout Summary - media/20180315-1946080o.csv

--|Total|-Total-|--Avg--|-Avg-|Avg-|-Avg-|-Max-|-Avg

--|Dist-|-Time--|-Pace--|-Pwr-|SPM-|-HR--|-HR--|-DPS

--|08141|36:00.0|02:12.7|180.9|22.3|158.6|180.0|10.2

W-|06319|24:00.0|01:53.9|237.9|24.9|158.1|179.0|10.6

R-|01838|12:00.0|03:15.9|066.8|17.1|159.6|179.0|95.0

Workout Details

#-|SDist|-Split-|-SPace-|-Pwr-|SPM-|AvgHR|MaxHR|DPS-

00|00257|01:00.0|01:56.7|209.4|22.8|118.3|133.0|11.3

01|00258|01:00.0|01:56.4|219.8|24.0|148.3|156.0|10.8

02|00268|01:00.0|01:52.0|249.9|25.7|159.7|164.0|10.4

03|00279|01:00.0|01:47.7|277.7|27.3|166.8|170.0|10.2

04|00247|01:00.0|02:01.5|198.8|21.1|139.5|147.0|11.7

05|00260|01:00.0|01:55.4|227.5|24.2|152.0|157.0|10.7

06|00270|01:00.0|01:51.2|253.5|26.1|161.9|168.0|10.3

07|00276|01:00.0|01:48.5|274.0|27.7|171.3|174.0|10.0

08|00248|01:00.0|02:01.1|195.4|22.5|136.3|146.0|11.0

09|00257|01:00.0|01:56.9|218.8|24.4|153.3|157.0|10.5

10|00268|01:00.0|01:52.0|248.7|25.9|164.0|169.0|10.3

11|00279|01:00.0|01:47.5|280.5|28.1|173.7|176.0|09.9

12|00244|01:00.0|02:03.0|202.5|21.8|143.7|152.0|11.2

13|00259|01:00.0|01:55.6|225.6|24.4|158.0|164.0|10.7

14|00269|01:00.0|01:51.3|252.7|26.3|169.8|173.0|10.2

15|00279|01:00.0|01:47.7|279.3|28.1|176.0|179.0|09.9

16|00242|01:00.0|02:03.9|190.8|20.2|141.9|152.0|12.0

17|00260|01:00.0|01:55.3|227.1|23.5|161.0|168.0|11.1

18|00269|01:00.0|01:51.5|252.7|25.4|170.6|174.0|10.6

19|00278|01:00.0|01:47.9|277.3|27.7|176.0|179.0|10.0

20|00247|01:00.0|02:01.5|195.7|21.5|144.2|152.0|11.5

21|00260|01:00.0|01:55.5|226.6|24.4|159.4|165.0|10.6

22|00268|01:00.0|01:51.8|249.6|25.9|170.6|175.0|10.4

23|00278|01:00.0|01:48.1|275.5|28.0|177.5|179.0|09.9
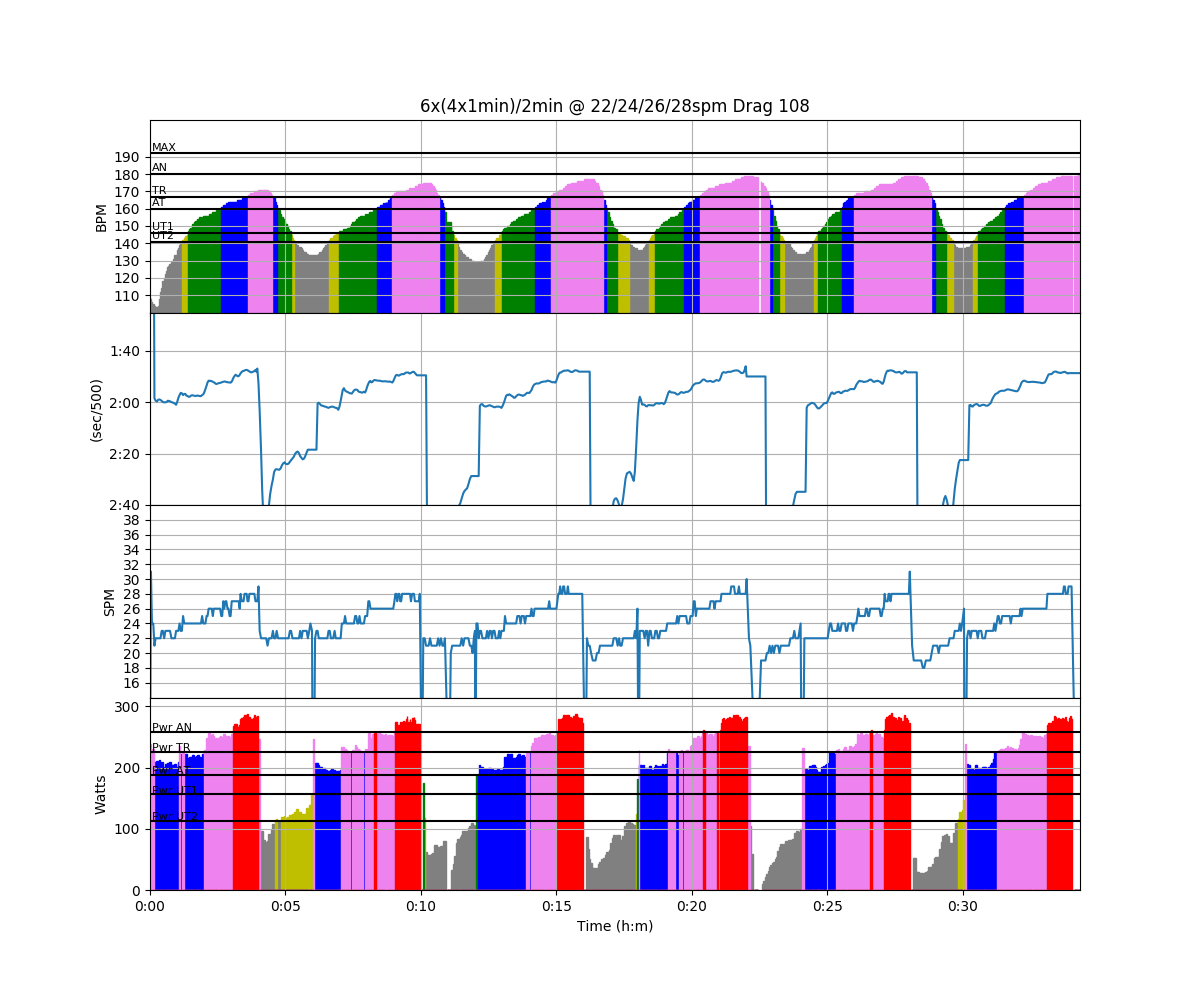
Great. But it is more interesting to look at some charts.
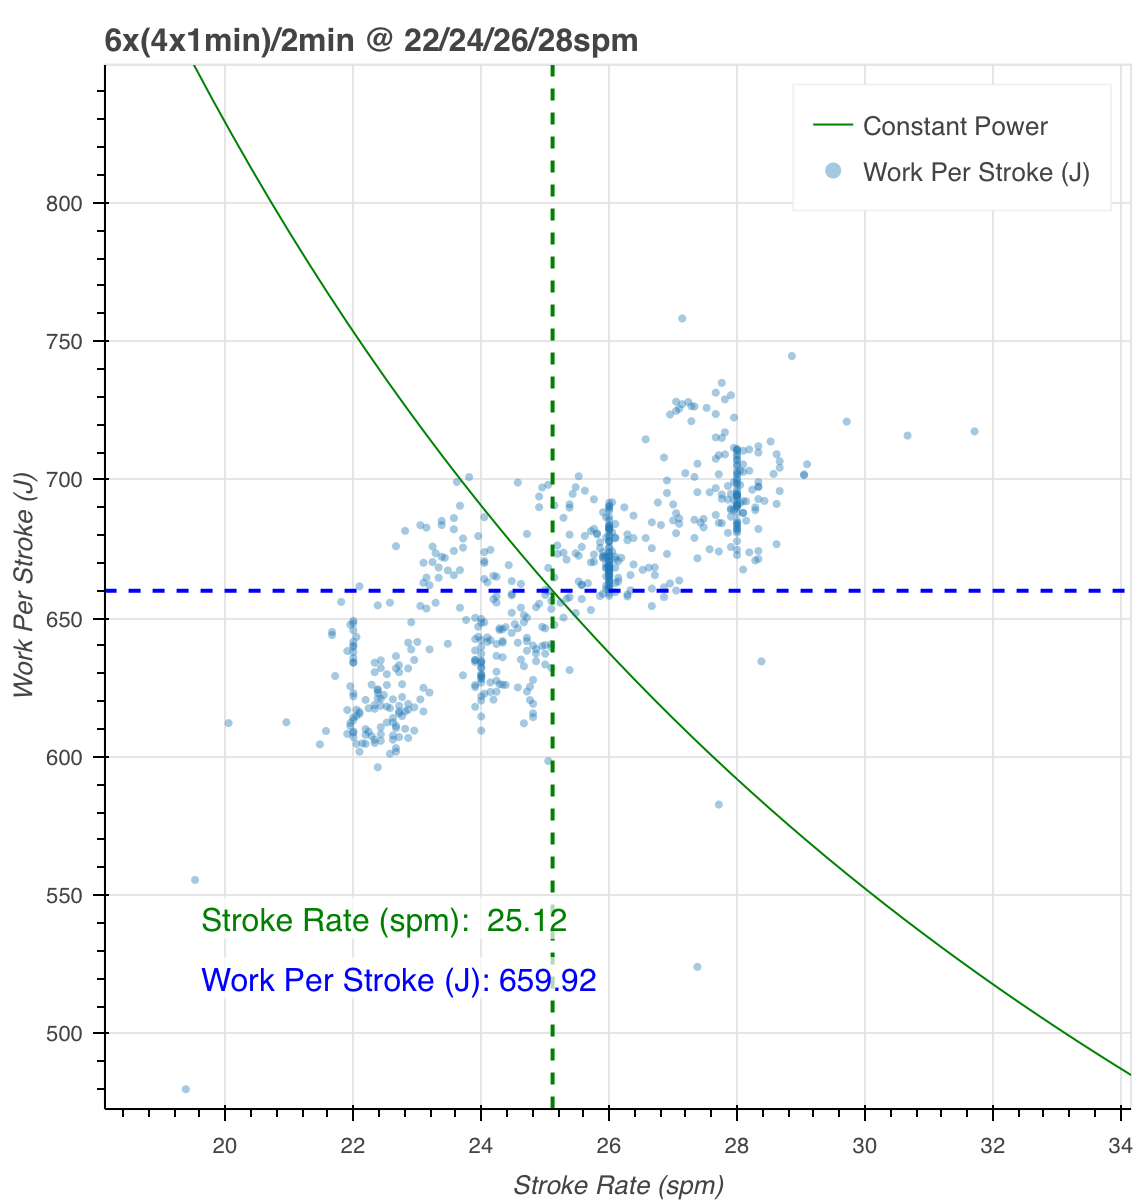
Again, I am slightly increasing Work per Stroke when rating up. Drive length is pretty constant:
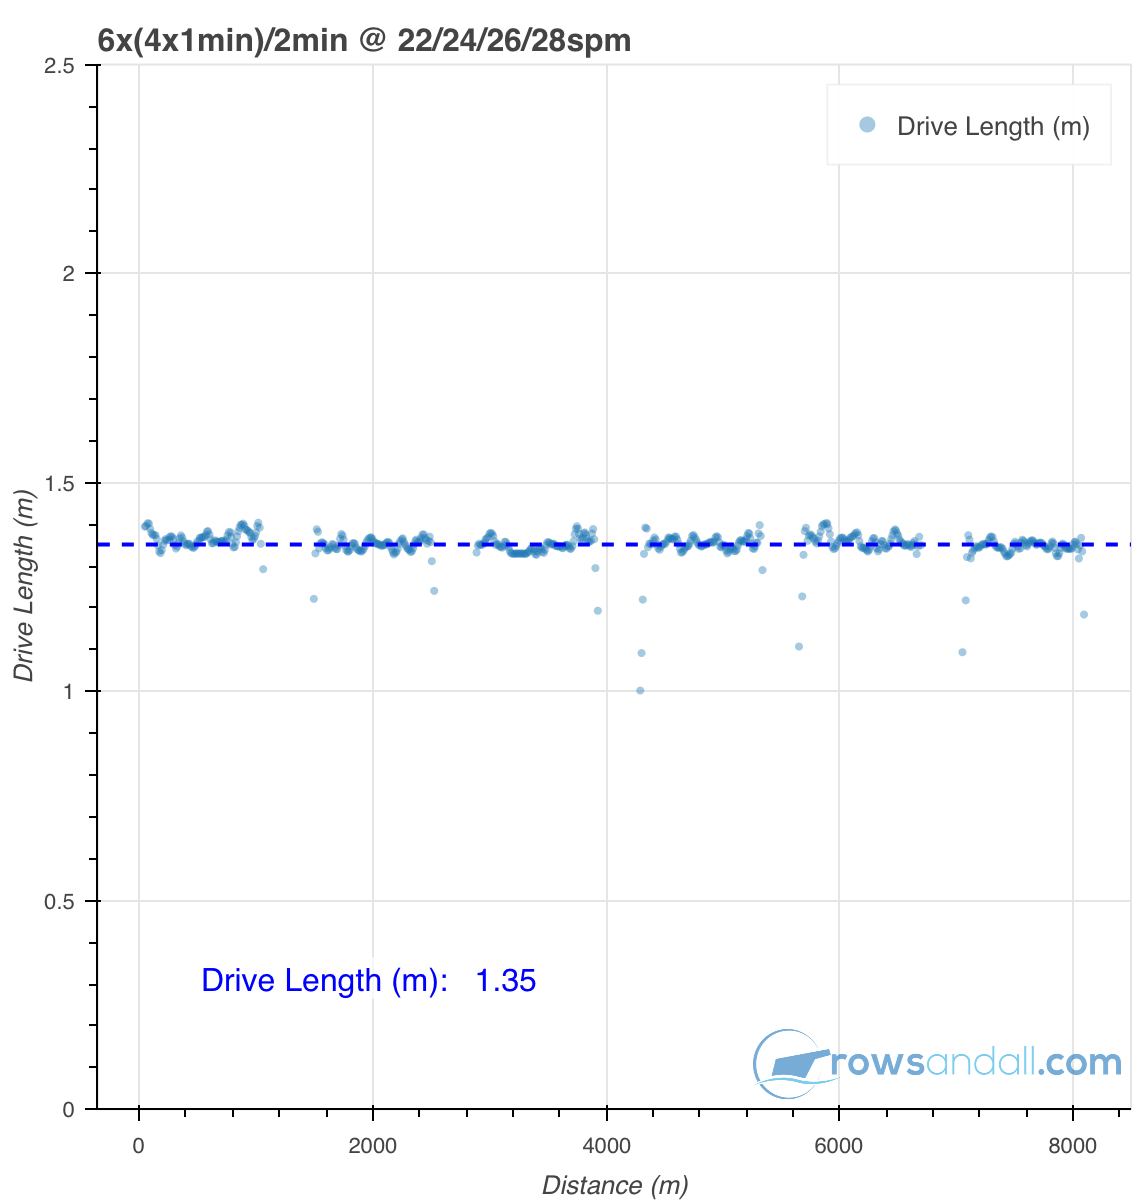
That’s about it. Pretty good.
How-To
There isn’t much to add to the how-to of Workout 1. I used Painsled on the iPad, connected to my PM5 on a static Concept2 model C ergometer. After the workout, I emailed the files to workouts@rowsandall.com. Once I received the confirmation email, I opened the main session on rowsandall.com.
I opened the workout in “Workflow View”, a configurable page on rowsandall.com. On the left, there is a navigation bar which you can configure to your liking. I have added “Edit Intervals” near the top. That is where I go, and submit “6x(1min+1min+1min+1min)/2min” as the workout description, which nicely separates the rest strokes from the workout strokes and tidies up the workout summary. The original summary auto-generated based on Painsled’s CSV file was pretty good, but as it is stroke based, you end up with intervals that are 3:58 minutes long instead of 4 minutes exactly.
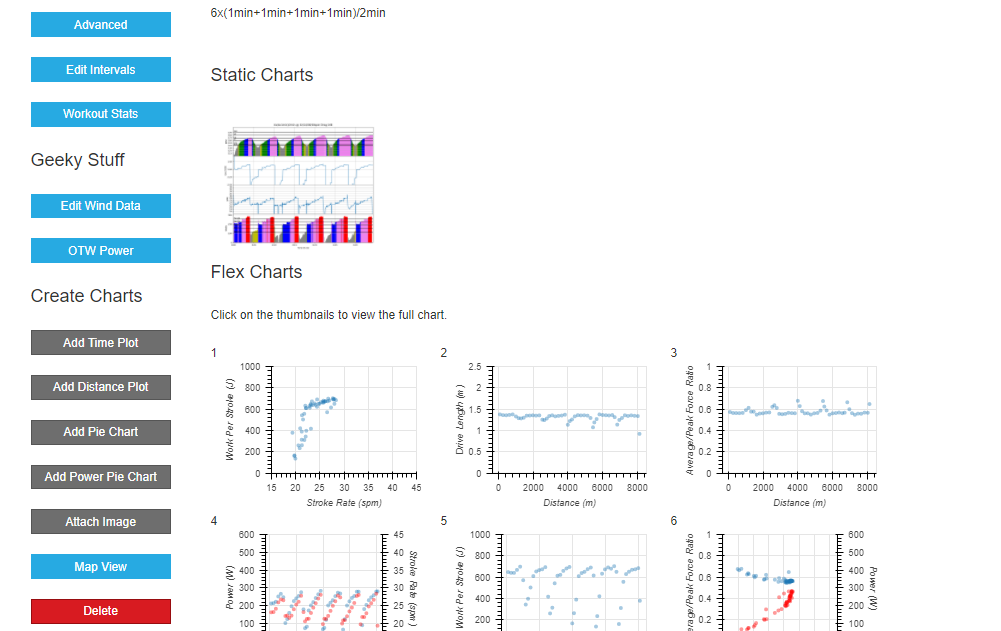
I take a quick look at the thumbnail of the session chart, which was created automatically because I put “chart time” in the body of the email.
The Flex Charts section is interesting. Here, I have thumbnails for all my favorite Flex Charts (which I can define on Rowsandall.com), and by clicking on one of them, I am automatically taken to the flex chart page. I click on the first one and get this:
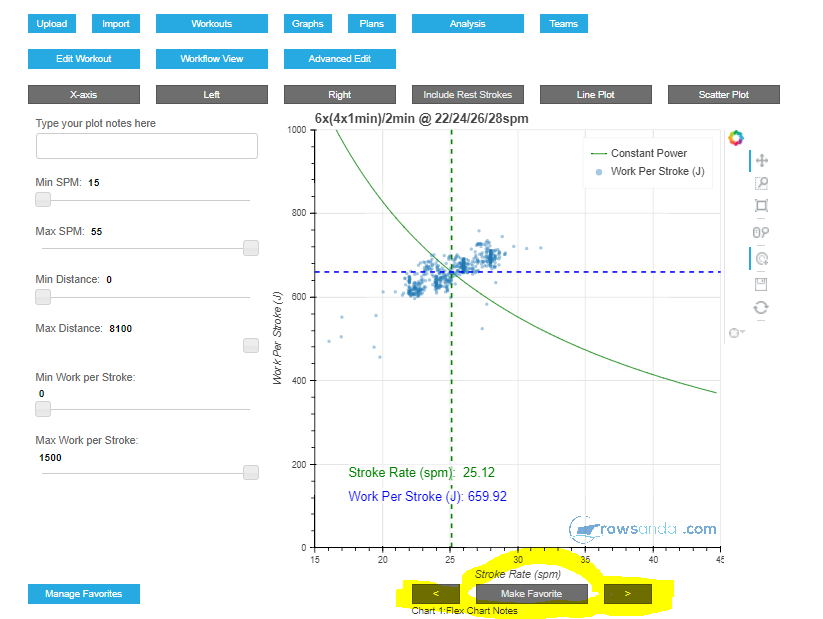
I have highlighted the navigation buttons on the bottom, which allow me to navigate between my pre-defined favorite Flex Charts. Of course, on each chart I can use the sliders on the left and the toolset to the right of the chart to interact with the data. These charts are interactive!
One of the charts is Drive Length. I use it to check that I didn’t do any wild things in terms of stroke length, such as starting to short slide when things get tough. Today, I didn’t.
Workout 3
The Workout
Just an hour of steady state.
In my optimism, I had planned for a “technique row” OTW for Friday. It was below zero, and I skipped training altogether.
During this erg row in my basement, it was snowing outside. Everything is white, as if we have been set back three months in time.
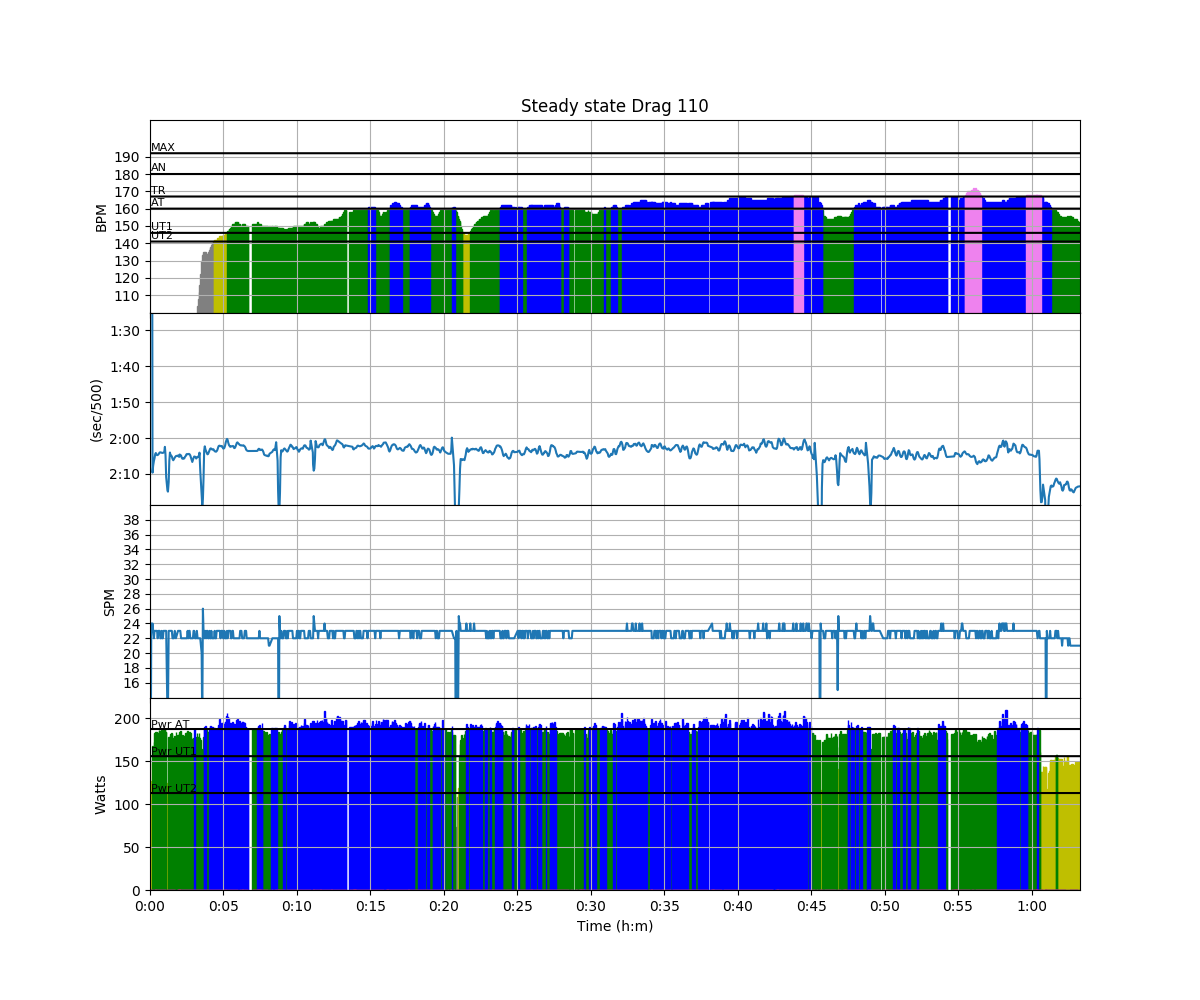
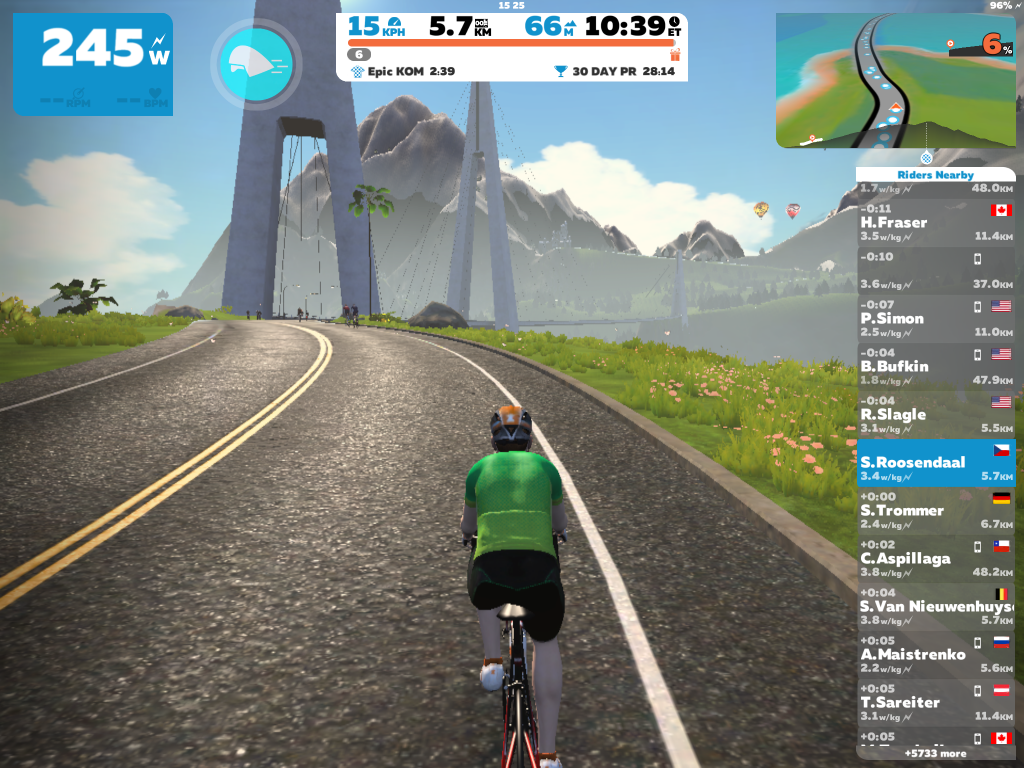
I used Zwift again. Here I am riding into the mountains.
How-To
Today, I am riding on Zwift. Don’t panic. Everything is still captured in Painsled. How does this work. You need:
- An iPhone running Painsled
- An iPad running Zwift
Here is an example of how that looks:
Workout 4
All worked out well.
I planned a “hard 6k” for Saturday, anticipating that I would be able to do it on the water, in the single. So, although it was supposed to be a hard 6k, I never intended it to be a full out one, this being my first or second OTW row of 2018.
It all worked out differently. It snowed on Saturday, and I decided to do the Steady State workout on my erg in my basement, and move the 6k to Sunday, when a small group of our Masters rowers meet at the rowing club and erg together.
I put the erg on slides, to get a bit closer to the OTW feeling, and, admittedly, also because erging a 6k is so much easier on slides. Did I mention that I am considering buying slides for use at home? I found a local guy who can make them really cost effective.
So here is the entire workout
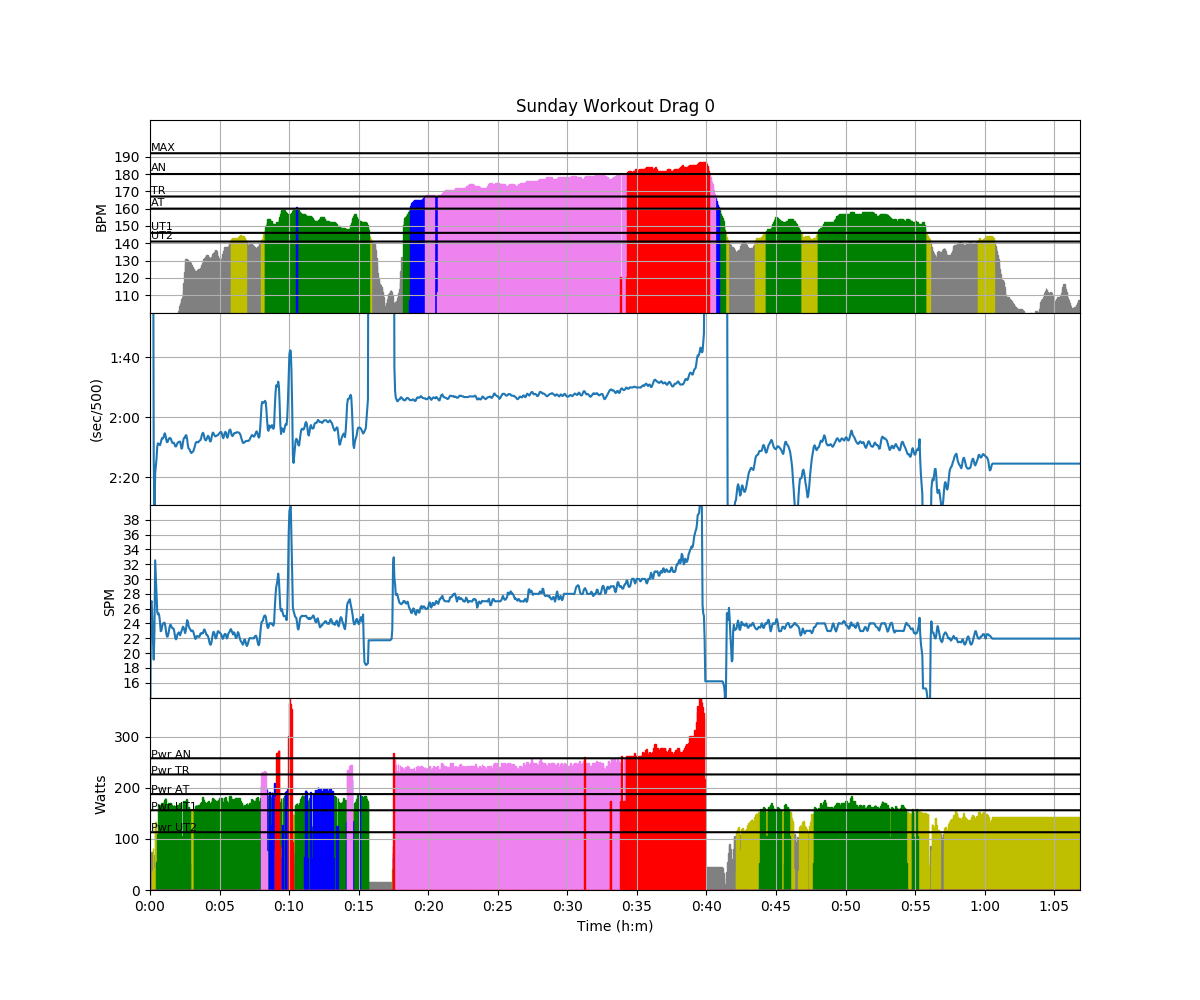
I did a nice long warming up with some speed bumps. It’s easier to rate up on slides, so I found myself doing 40spm for a few strokes. Then, while the rest of the Masters started their 4x8min/2min workout (at 22/24/26/22spm), I started my 6k. The plan was to stick to 1:54 pace for the first 2400m and be careful, but I did see a lot of 1:52 pace, and when I got enthusiastic, even some 1:52 and 1:51.
With the other rowers next to me, I didn’t have difficult rating up in the second half of the row. It’s amazing how much peer pressure helps, although I also think that for a lightweight as me, rowing on slides is a definite advantage.
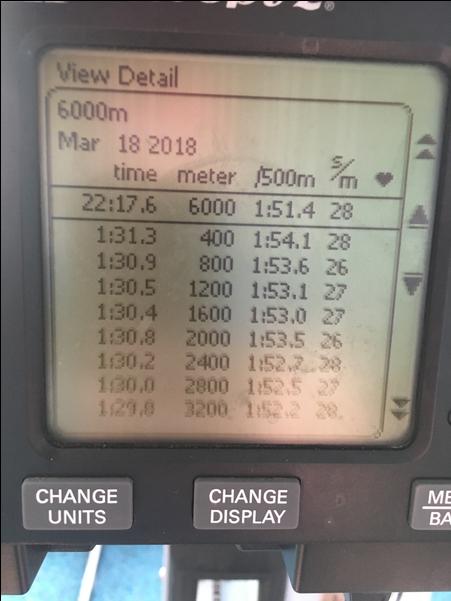
Workout Summary - media/20180318-1530530o.csv

--|Total|-Total-|--Avg--|-Avg-|Avg-|-Avg-|-Max-|-Avg

--|Dist-|-Time--|-Pace--|-Pwr-|SPM-|-HR--|-HR--|-DPS

--|06000|22:16.0|01:51.4|253.1|28.7|0.0|000.0|09.4

W-|06000|22:17.0|01:51.5|253.1|28.7|000.0|000.0|09.4

R-|00000|00:00.0|00:00.0|000.0|00.0|000.0|000.0|00.0

Workout Details

#-|SDist|-Split-|-SPace-|-Pwr-|SPM-|AvgHR|MaxHR|DPS-

00|00500|01:53.1|01:53.1|237.5|27.1|000.0|0.0|09.8

01|00500|01:53.6|01:53.6|239.5|26.6|000.0|0.0|09.9

02|00500|01:52.9|01:52.9|241.7|27.3|000.0|0.0|09.7

03|00500|01:53.5|01:53.5|240.9|27.0|000.0|0.0|09.8

04|00500|01:52.7|01:52.7|243.0|27.4|000.0|0.0|09.7

05|00500|01:52.2|01:52.2|247.1|27.9|000.0|0.0|09.6

06|00500|01:52.5|01:52.5|245.5|27.7|000.0|0.0|09.6

07|00500|01:52.5|01:52.5|247.4|28.3|000.0|0.0|09.4

08|00500|01:51.4|01:51.4|252.6|29.0|000.0|0.0|09.3

09|00500|01:49.5|01:49.5|265.1|29.8|000.0|0.0|09.2

10|00500|01:48.4|01:48.4|274.2|31.1|000.0|0.0|08.9

11|00500|01:45.5|01:45.5|307.8|35.2|000.0|0.0|08.1
Not a bad workout. Actually a Season’s Best, and pretty close to my PB (of 2 years ago) of 22:13.1.
Here are a few of the flex charts that I found interesting:
How-To
Rowing in our rowing club’s erg room is always a challenge, data wise. The ergs have PM3 monitors, and no heart rate adapter. To get Painsled to register anything, I need to use the iPhone connection kit plus a lightning to 30 pin adapter to get my iPhone to work with the monitor.
[amazon_link asins=’B074KG6G5Q’ template=’ProductCarousel’ store=’rowingdata-20′ marketplace=’US’ link_id=’77f1393f-2ad8-11e8-814d-abd3cf302b13′]
I do record heart rate separately, using the Polar OH1 optical heart rate belt worn on my upper arm. This heart rate band has a standalong mode, which syncs to Polar Flow, and then to Strava. Then, I can import the heart rate data using the Strava connection to rowsandall.com.
Before I merge the heart rate data with the rowing data, I first glue warming up, 6k and cooling down together on rowsandall.com, as described here.
Then, I go to the Advanced Edit page for the workout and select “Sensor Fusion”: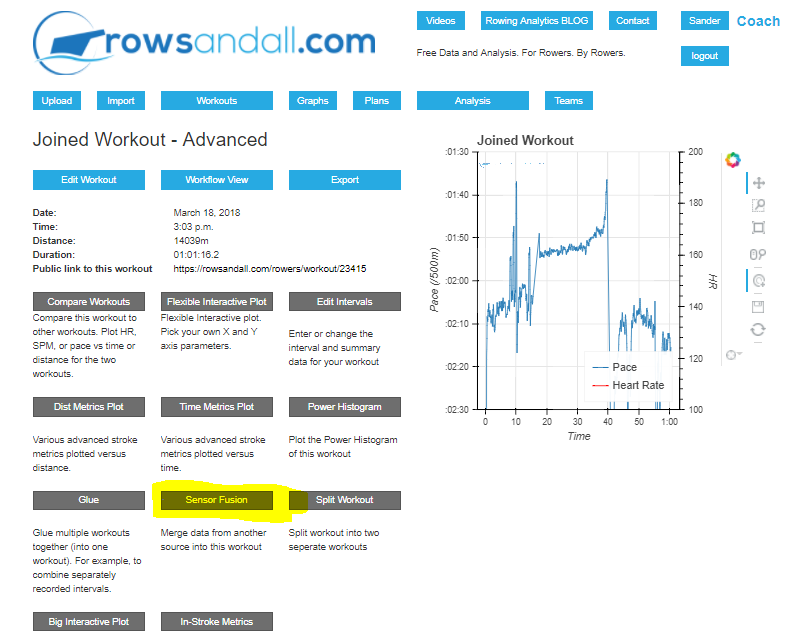 Clicking the highlighted link brings me to a page where I select the heart rate data imported from Strava, and then I get to this page:
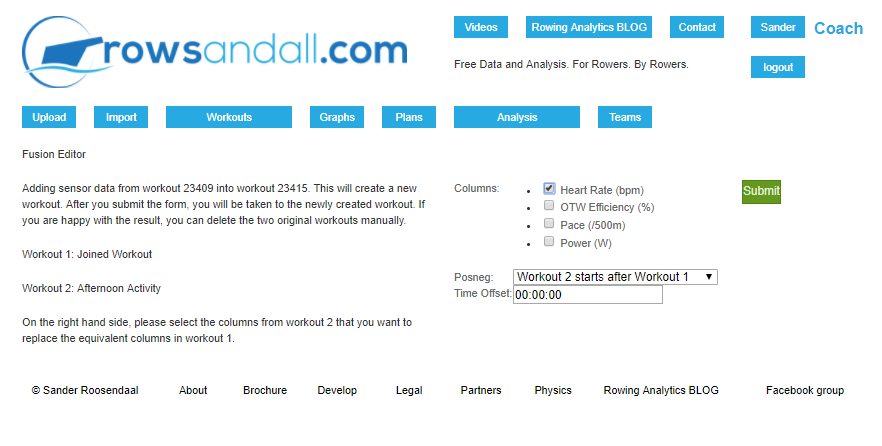
I select heart rate, and as I started the heart rate band at the same time as I started rowing, I don’t need to edit the time offset.
If I wanted, I could now split the resulting workout again to get a nice record for my 6k with heart rate, but I didn’t have a need for that.
The sensor fusion, joining and splitting are experimental functions on rowsandall.com, and you have to try which approach gives you the best result. I find that when the workout durations are very different, like today where the OH1 recorded one hour long record, but the painsled workouts where divided in three parts, it is more efficient to first glue together the rows, and do the data fusion with workouts of approximately the same length. That creates a nice workout record for the entire session, which can then be split up again if you want.
For the stroke metrics plots, I used the original Painsled 6k workout, without heart rate data, and just browsed through my defined set of favorite flex charts, zooming in on stroke length and work per stroke using the flex tools. Pretty happy with what I saw.