
Part 1 of this series discussed using the Concept 2 online rankings as the source of the data and the methods used to analyze the data.
Part 2, looked at the impact of aging on 2k performance for different groups of athletes and found that lightweights have a different characteristic change over time than open weight rowers. There was also an examination of whether top rowers decline at a faster or slower rate than average rowers.
In part 3 of this series we will be looking at different event durations. There is considerable anecdotal evidence that sprint performance declines faster than long duration performance and there is physiological evidence that muscle composition changes with age. But is there direct evidence in the Concept2 rankings to show a different rate of decline for different length events?
As shown in Part 2, the decline is different for each class of athlete, so we will start by looking at Open Weight Male Rowers, the cohort with the largest population.
The following gallery shows the decline by age for a few different duration events.
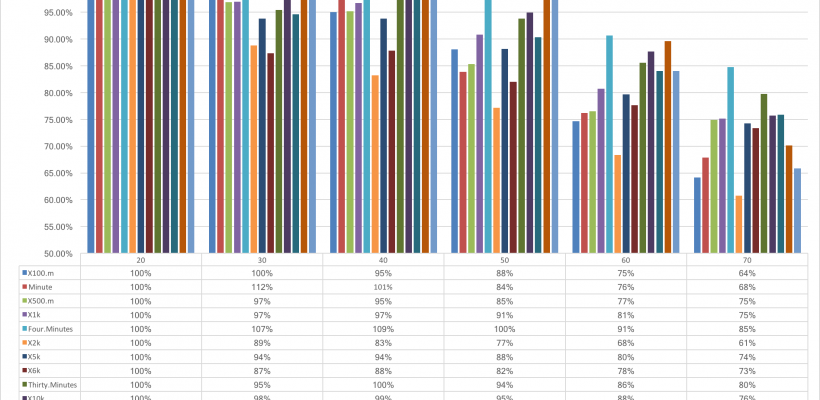
The decline for the 50th percentile open weight male rower were compiled for a number of events and summarized in the table below.
A more illustrative way to look at this is to show the decline for each event on the same chart. This chart normalizes to the power achieved in the 20-29 age group and then shows the decline as a percentage of that power for each event.
Here’s an example using open weight men at the 50th percentile.
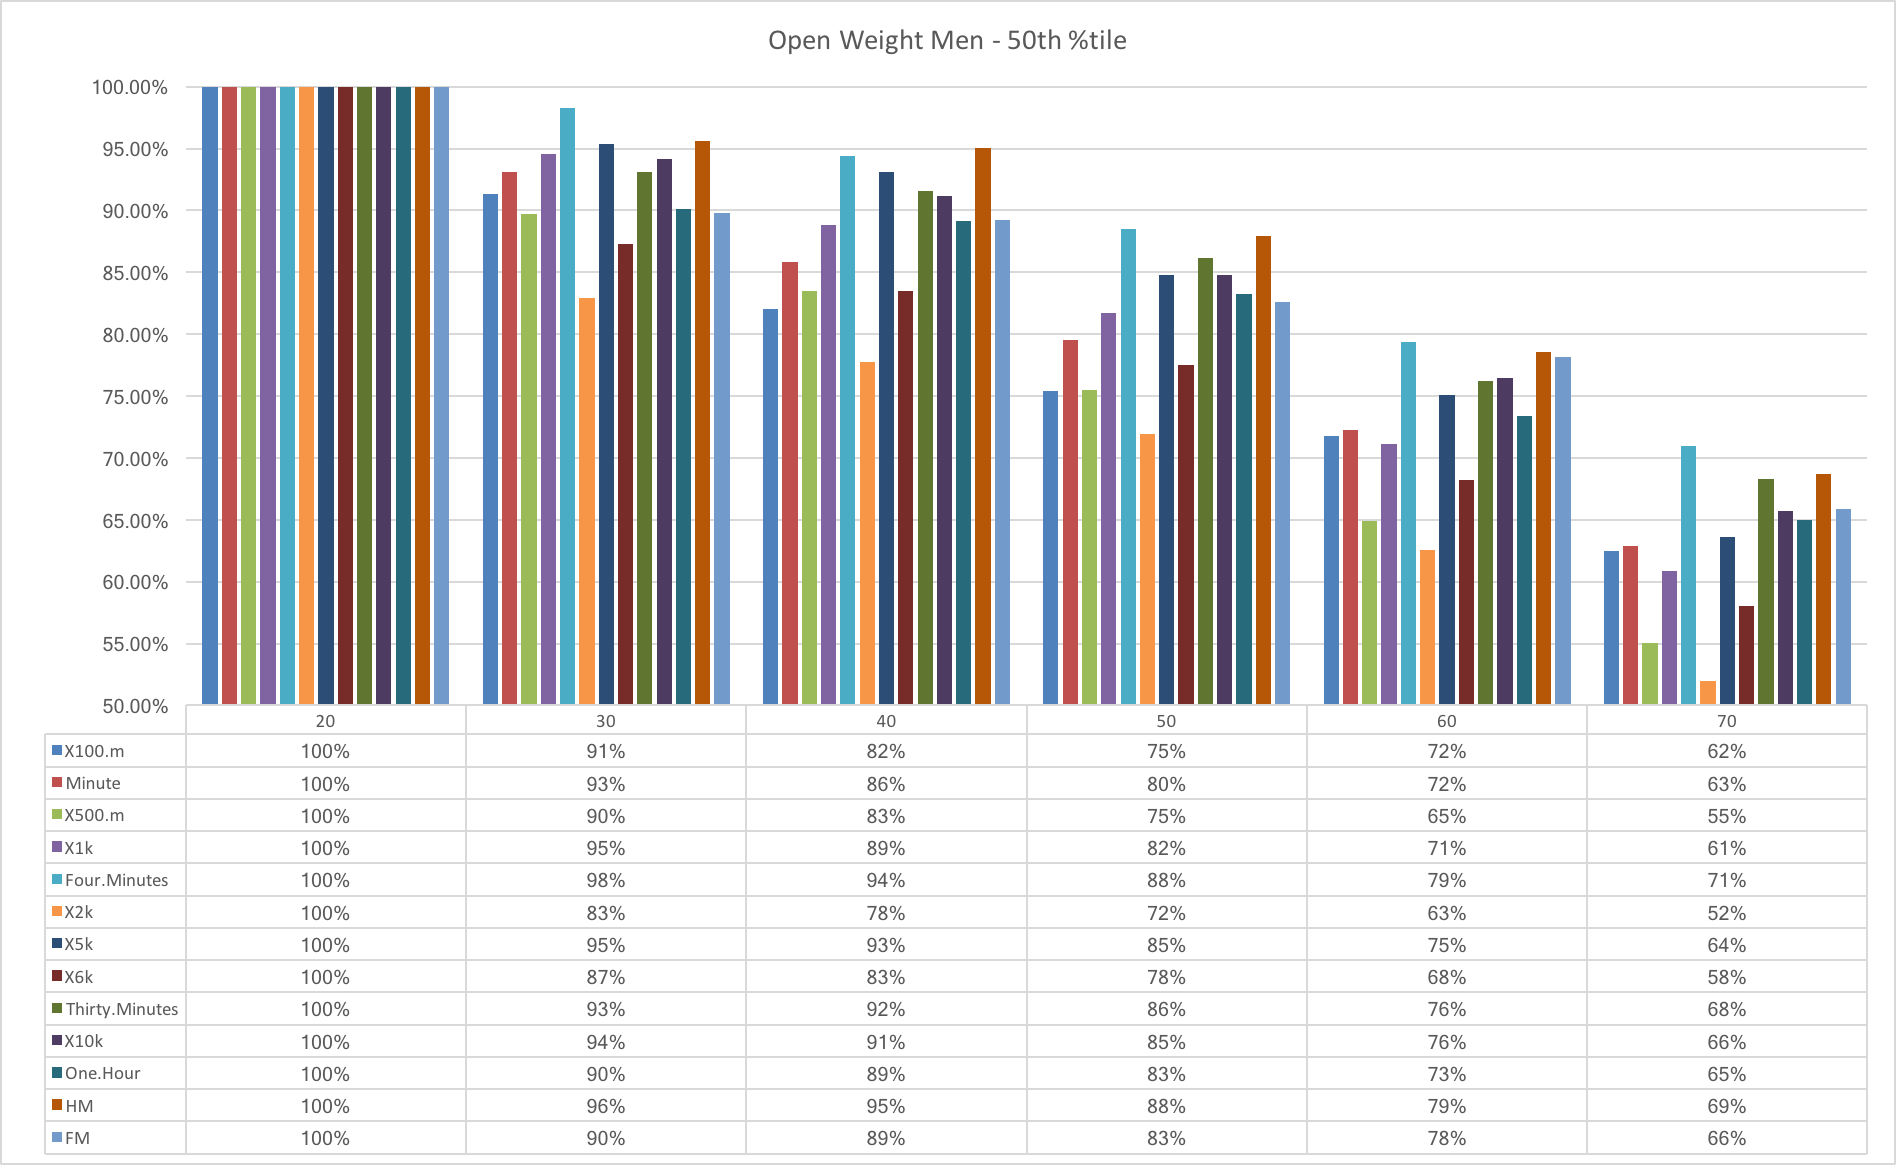
Using the 100m event as an example. The 50th percentile power for the 100m event in the 20-29 age group is 658W. The 50th percentile power for the 30-39 group is 601W, which is 91% of 658W. All age groups are referenced back to the 20-29 power.
At first glance it looks like the longest events sustain better over age than the short events, but there are some other features in the data that deserve some examination.
The most notable trend is that the 500m, 2000m and 5000m show the steadiest and most significant decline. These three events show the most significant decline in the 30-39 group as well. It is not a coincidence that these three events are the highest participation events for rowers under 30. In essence, these events are the most competitive events in the 20-29 age groups and this group include collegiate and pre-elite international rowers. They set a very high bar.
The 2000m event’s decline is quite significant because it is the highest participation event in each age group and is generally considered the most competitive event. It is my belief that the trend shown for the 2K more accurately reflects the highest potential of age group athletes.
However, even restricting to the highest participation events, 500m, 1K, 2K, 5K, 30 Min, and 10K, it is clear that performance in the longer events sustains better over age than the shorter events. The decline across the 500m, 1000m and 2000m is an average of 56%. The decline across the 5K, 30 Min and 10K is 66%. A 10% difference in power is quite significant. The take away lesson is that you apply a “rule of thumb” about age related decline that was derived from 2K performance to the 10K, you would end underestimating your potential performance in that event.
The same trends exist for both sexes and weight classes and are reasonably consistent for the 50th, 75th and 90th percentile levels. In the 2k data, lightweight rowers of both sexes showed better performance in their 30s and 40s compared to heavyweight rowers. This trend extends to other distances as well. The following gallery shows each so you can find the one that is best lined up for you.
In the next part of this series, I will compare the data about age related performance in the C2 rankings to the US Rowing Age Handicap system. Since the handicap system applies the same correction factor for both sexes, both weight classes and for all event distances, it should be interested to see how much the current rules help (or hurt) different groups of rowers in different events. (Spoiler alert: It’s a much bigger difference than the brand of boat you are rowing)