This is the first part of a multipart series. It describes the topics that will be discussed and provides some background on the data source and methodology that were used. Subsequent articles will dig into each of the questions described below.
Recently, Sander Roosendaal developed a python tool that could read data from the Concept2 Online Rankings and capture it in a form that enabled statistical analysis. With this data, he validated an adaptation of the Critical Power Curve (CP Curve) to indoor rowing, and published an article here: Ergometer Scores: How Great Are You
With the ability to capture and analyze rankings data, and the concept of CP Curve for indoor rowing, I saw an opportunity to research some questions that I’ve been wondering about.
The questions I wanted to look into were:
- How much do rowers slow down as they age?
- Is the slow down different for each gender and weight class?
- How is the slow down related to event duration?
- Do the best rowers of each class slow down at different rate than the whole population?
The answers to these questions are important for Masters Rowers for a few reasons.
- As rowers age, it is often frustrating to see performance decline. By looking at broad set of data, it may be possible for age group athletes to establish goals to “stay ahead of the curve” vs fruitlessly trying to exceed PRs from the distant past or give up on competitive training. Probably the best example that exists now of leveling the playing field for indoor rowing is the Nonathlon. As the name implies, this is an online competition across nine events. The creator of the competition used Concept2 ranking data to establish a “Gold Standard” by gender, weight class and age. This allows all rowers to compete with each other. (Highly recommended!)
- The balance between aerobic and anaerobic fitness is often used in developing training plans. The benchmark for this balance has been typically drawn from the characteristics of the young elite rowers. It is possible that the best age group rowers have a different balance of aerobic to anaerobic fitness and these training plans are not optimized for aging athletes.
- Many rowing events use the USRowing age handicapping rules which provide a single number, seconds per km, related to age, but independent of weight class or gender. Is it possible that the handicapping rules are ill fitted for certain groups?
- Current discussions about age related decline are usually based on anecdotal evidence. By using proper statistical methods, we bring some rigor to the analysis.
Methodology
The data source for this study is the Concept2 Online Rankings. Concept2 has maintained an online logbook for their customers to record scores and rank them against each other since 2002. By choosing to “rank” a score, a rower is disclosing their best performance on an event in specific season for comparison to other rowers. The data are organized in seasons, which run from May 1st to April 30th of the next year, and archived after the season is complete. The season runs from May to April of the following year. So, the 2018 season runs from May 1st of 2017 to April 30th of 2018. The data is self entered. A small segment of the data is verified, either by being witnessed at a race, by using RowPro, or by entering a validation code from the performance monitor. In general the “honor system” is used. Questionable results, if they are high in the rankings can be challenged through Concept2. Therefore, it is possible for there to be errors or false scores in the data. However, I have assumed that the vast majority of ranked score are legitimate and any outliers do not effect the statistical analysis.
Using Python, all rankings data from the 15 archived seasons, plus the 2018 season were scraped into a single file. All of the ranked pieces for each rower in each year are collected into a single “Ranking Record” for the rower. The data includes both genders and weight classes.
The python script attempts to fit a Critical Power Curve (CP Curve) for each rower. The CP Curve is a model that predicts the duration for which a rower will be able to sustain a specific power level. Obviously, the shorter the time duration, the higher power one can hold.
In general, the script will successfully fit a CP curve if a rower has ranked at least 3 pieces of different duration. In some cases if the scores are for closely spaced events, more may be required. If successful, the CP curve is then used to estimate the rowers performance for specific durations (10 Seconds, 1 Minute, 1 Hour), even if the rower has not ranked them. This enables the comparison of the entire group of rowers that have ranked multiple pieces, even if they have not ranked the same ones.
After all results have been collected and CP curve coefficients calculated, the resulting database was analyzed using “R”, an free, powerful statistics package.
The Data
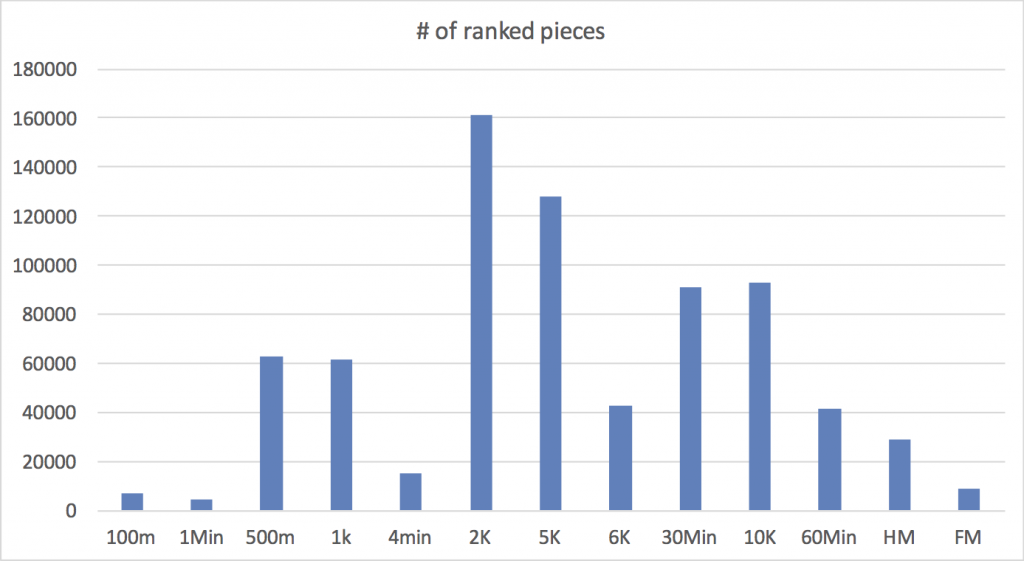
From the 16 years that ranking have been kept, over 700,000 pieces have been ranked.
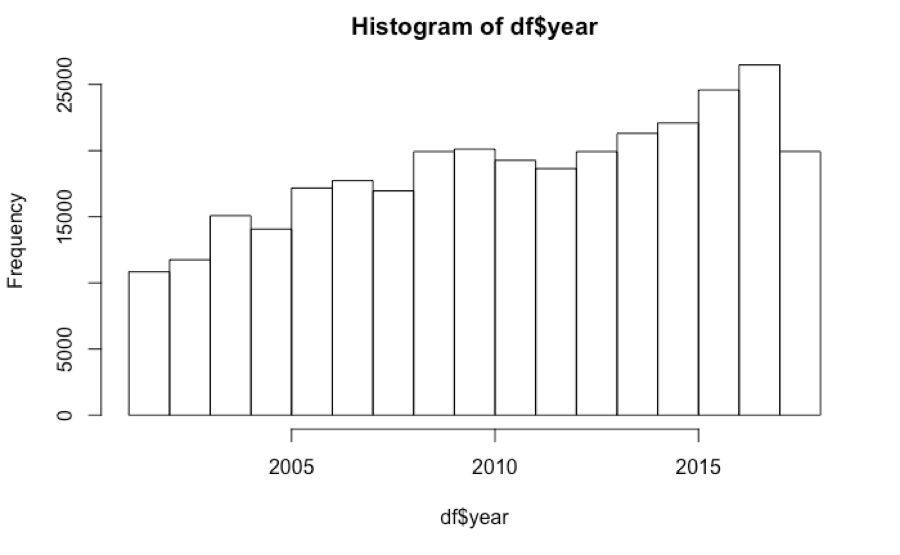
Over the 16 years, the level of participation has increased steadily. Reflecting the increasing popularity of indoor rowing, there is a steady increase in the number of rowers participating in ranking the past 16 years. Participation has more than doubled from 10,829 in 2002 to 26,469 in the most recent complete season.
The most popular ranked pieces are the 2K and 5K, each with more than 100,000 ranked results. The number of 100m and 1 Minute rankings is small because they have only been tracked for the past 3 years. The number of full marathons ranked is small because only crazy people do marathons on ergs!
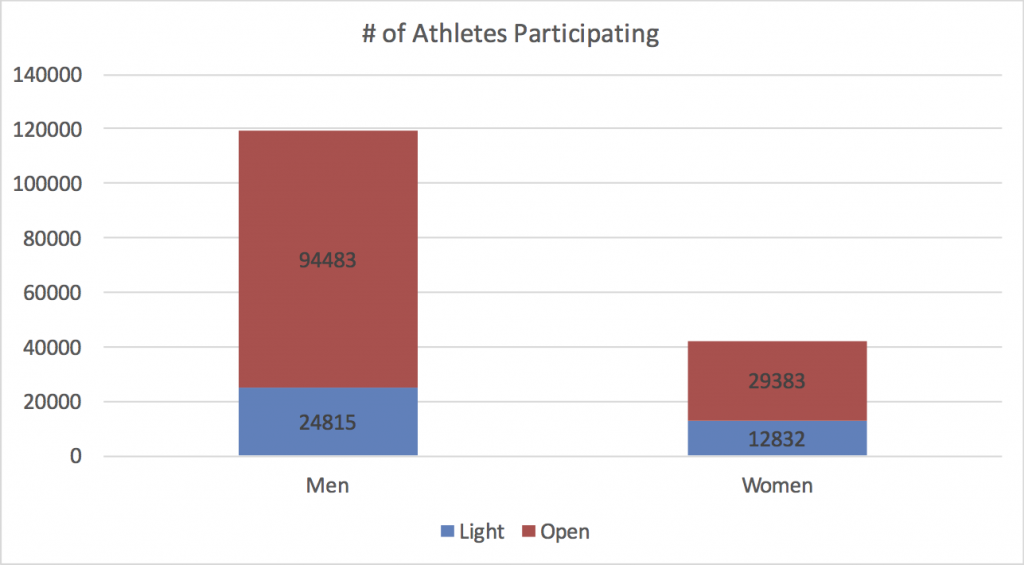
Most of the analysis will be focused on specific groups of athletes. Male/Female, Open Weight/Light weight and age groups.
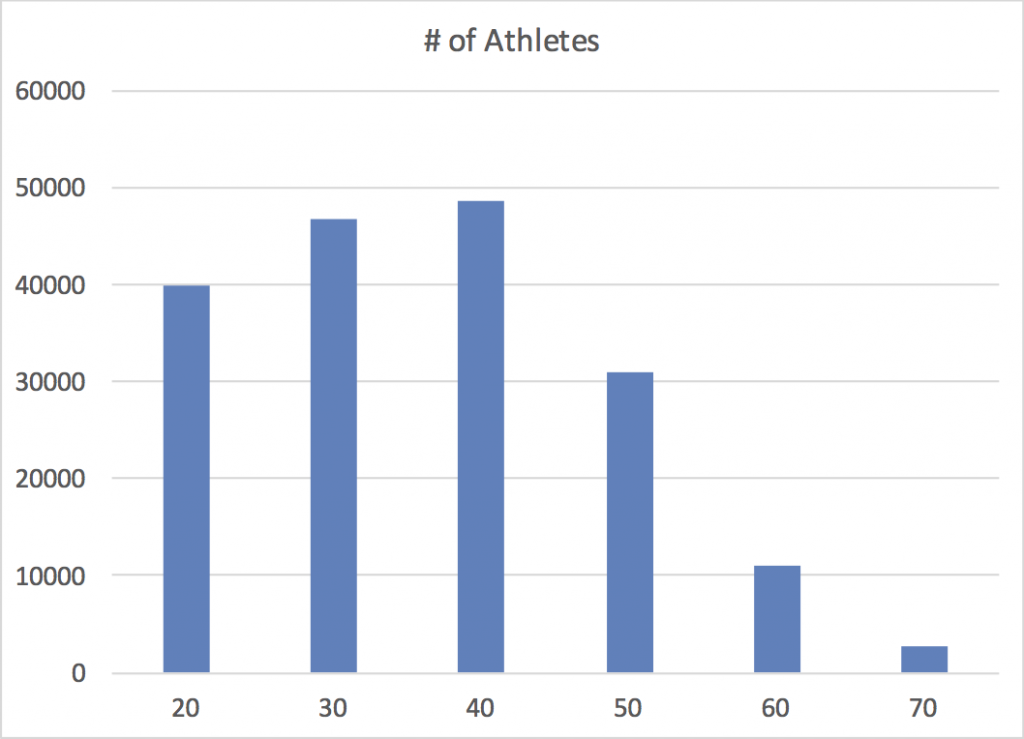
The breakdown by age shows strongest participation in the 30-39 and 40-49 age groups, but even for the 70-79 group, 2620 athletes have ranked results.
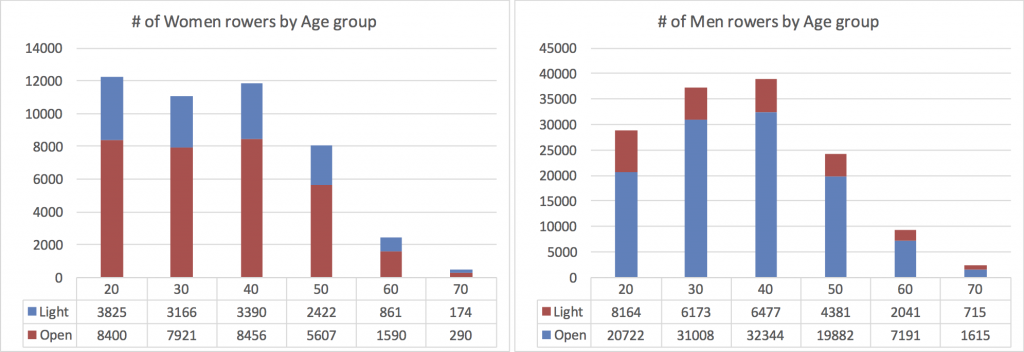
The numbers get smaller once you then divide into the gender and weight classes.
The implication of this is that conclusions drawn about lightweight women rowers over 70 might not have a lot of statistical validity. It also pretty clearly shows that number of rankings declines dramatically after 50. It’s interesting to ponder whether that is because people stop rowing, or if they stop competing or ranking pieces.
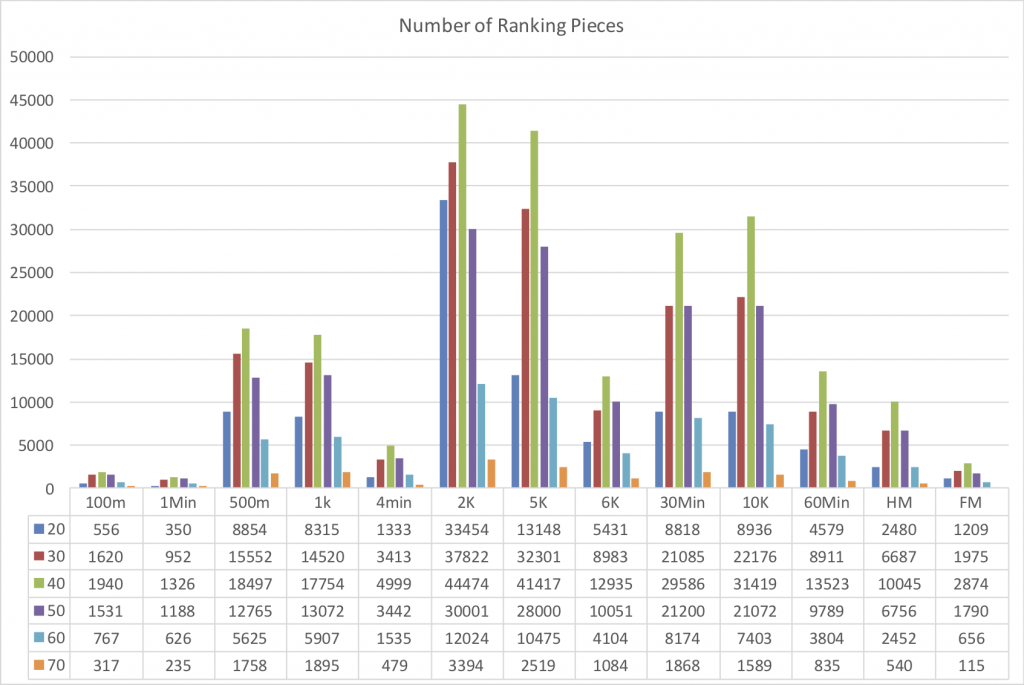
Breaking down the number of ranked pieces by age group shows that the there is much higher participation in 2k for the 20-30 group than any other piece. Otherwise, participation in events is roughly proportional with the totals for each event.
An important aspect of what I am trying to do is related to the power profile of specific rowers. This type of analysis is possible from the c2 ranking data because rankings are identified by name, and all events ranked in a single year by a specific rower have been collected together. If sufficient events have been ranked, generally 3 or 4 events, then a Critical Power (CP) curve has been fitted to the data, which enables rowers to be compared, even if they have ranked different events. They break down by class as follows.
Over subsequent parts of this series, I’ll be using this data to get a better understanding of age related decline in performance for different groups of athletes, looking at how the decline impacts events of different durations. I’ll also use the data to test the US rowing age handicap formula and see if some common “balanced fitness” benchmarks are valid for aging athletes.
