
One easy way to capture rowing data from the erg is to use ergdata, a free app available from Concept2 for iOS and Andriod.
If you row interval sessions using ergdata and you want to analyze the data on rowsandall, there are a few quirks that you need to be aware of. That’s the purpose of this post.
As an example, we can use a session that I did. It’s a session from the Eddie Fletcher Marathon Training Plan.
- 4 – 15 minute intervals, with 4 minute rests
- Each interval is 9 minutes at 5k power and 6 minutes at marathon power
- Note: 5k power and marathon are defined as a percentage range of your 2k power
The first step for this was to program the session into the PM. I set it up as a variable interval session so I could have a separate piece for each 9 and 6 minute interval. That way I could use the avg power on the display to try to stay on target.
This is what I programmed
work/rest
- 9’/0′
- 6’/4′
- 9’/0′
- 6’/4′
- 9’/0′
- 6’/4′
- 9’/0′
- 6’/0′
All together, that is 72 minutes of rowing (60 minutes of work and 12 minutes of rest)
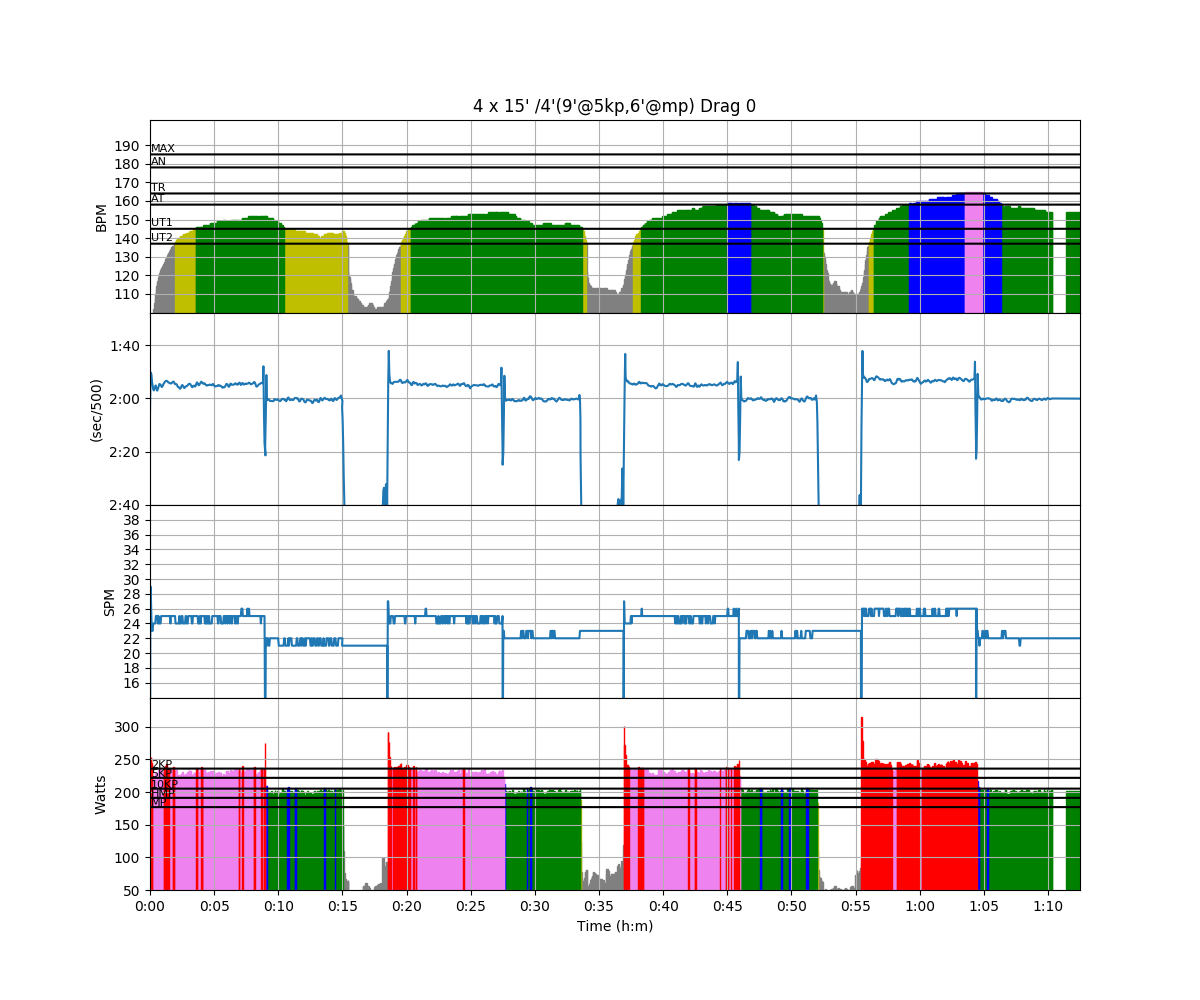
When you import the ergdata into rowsandall, it comes as a stroke file. All of your strokes, both work and rest are reported, so if you look at a graph of the data, it looks like this.
There is a bit of a strangness in the way that concept2 handles the time during the rest. Basically, if you stop taking strokes, the clock stops. So if you have a four minute rest, and you paddle for 3:30 and take a drink for 30 seconds, the rest will show up in the data as 3:30 long.
This makes defining the work and rest strokes in the interval edit a bit of a challenge.
Intervals are defined on rowsandall using the interval editor.
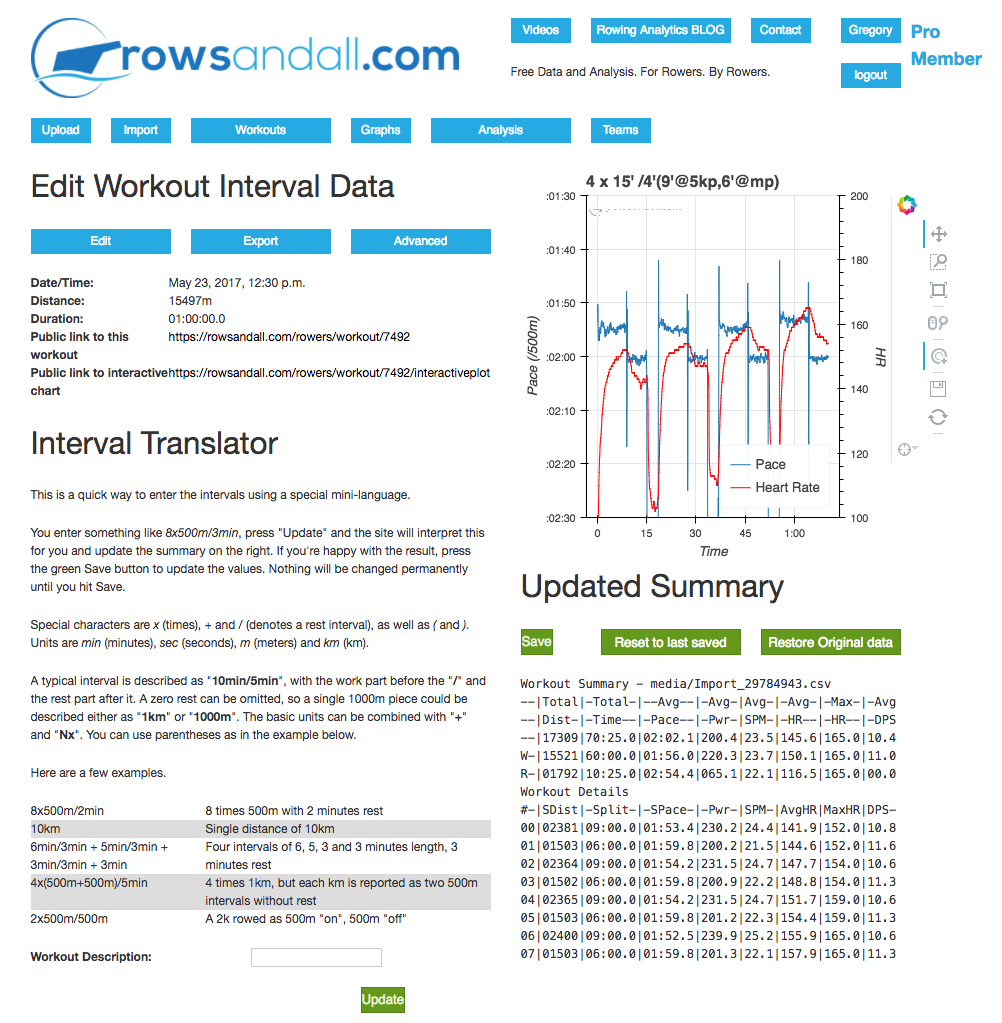
In the workout description, you need to define where the work strokes are and where the rest strokes are. You can use the plot in the upper right corner to help you figure it out. What I do is zoom in on that plot and find the transitions and write them all down.
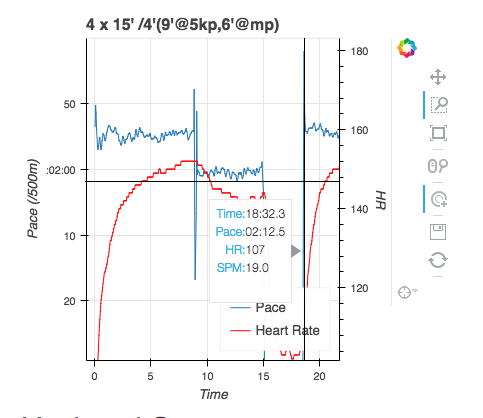
Here I have cursored over the beginning of the second interval. You can see the popup says that it starts a 18:32. If the full rest was recorded, that should be 19:00.
So, once you do that for all the transitions, you can build your definition…
9min/0min+6min/3.5min+9min/0min+6min/3.42min+9min/0min+6min/3.5min+9min/0min+6min/0min
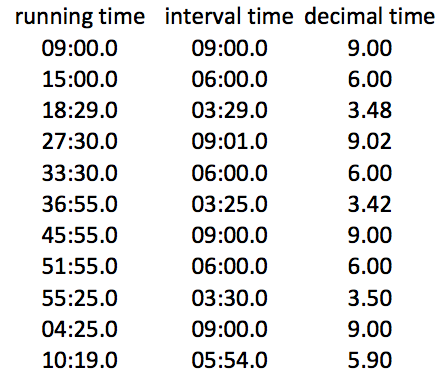
For sessions with tons of intervals, I’ve found it easiest to record all the times in a spreadsheet and then use math there to figure out all the individual segment times with decimal fractions of minutes.
The other option (if you are on iOS) is to use painsled which doesn’t have this problem.