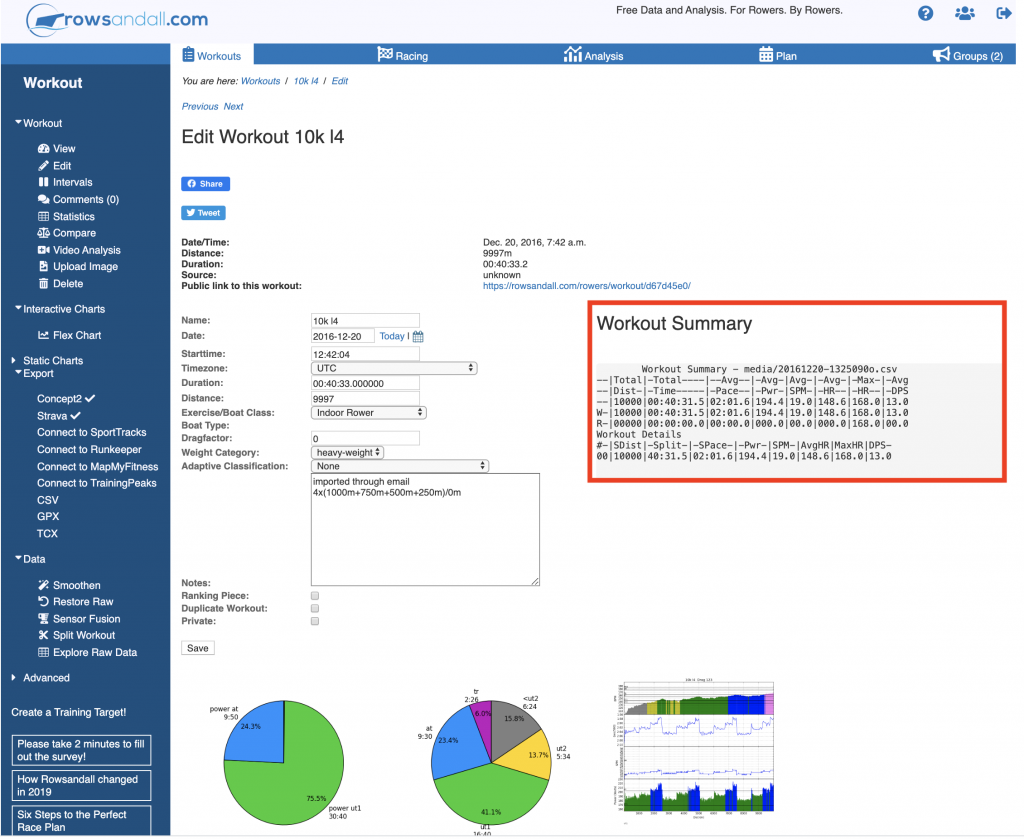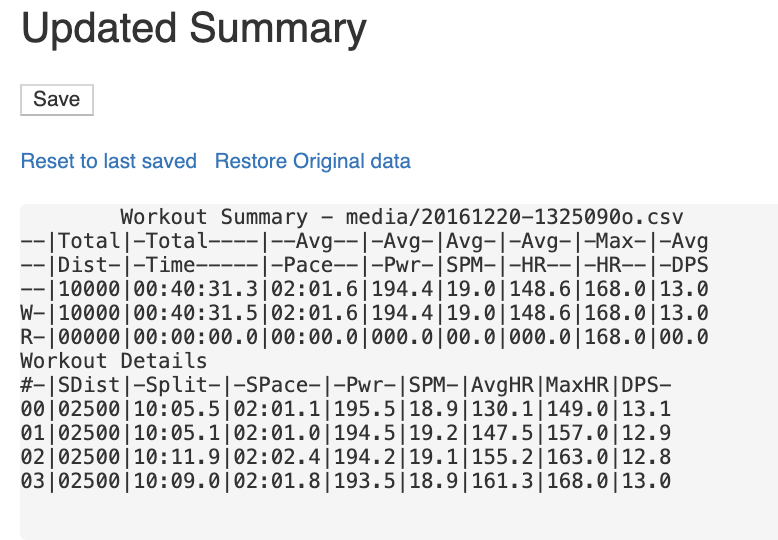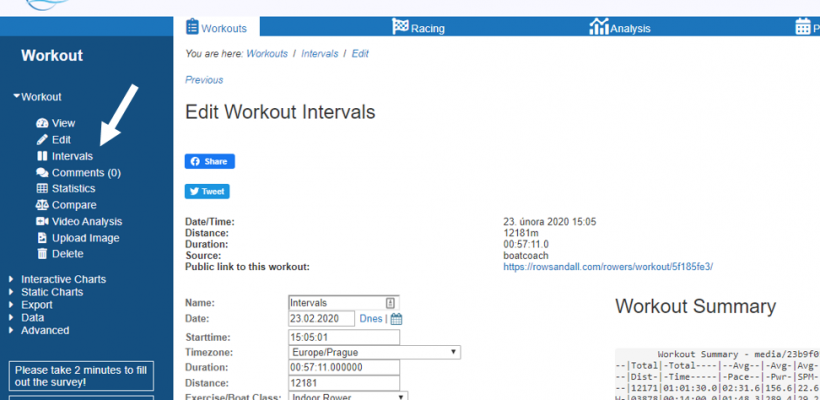
It can be very useful to look a summary statistics about rowing workouts. On the workout edit page, down in lower right corner, you can see the workout summary.
This area is text, so you can highlight and copy the text into other places. For example, you can plug it into a blog post, like this.
        Workout Summary - media/20161220-1325090o.csv
--|Total|-Total----|--Avg--|-Avg-|Avg-|-Avg-|-Max-|-Avg
--|Dist-|-Time-----|-Pace--|-Pwr-|SPM-|-HR--|-HR--|-DPS
--|10000|00:40:31.5|02:01.6|194.4|19.0|148.6|168.0|13.0
W-|10000|00:40:31.5|02:01.6|194.4|19.0|148.6|168.0|13.0
R-|00000|00:00:00.0|00:00.0|000.0|00.0|000.0|168.0|00.0
Workout Details
#-|SDist|-Split-|-SPace-|-Pwr-|SPM-|AvgHR|MaxHR|DPS-
00|10000|40:31.5|02:01.6|194.4|19.0|148.6|168.0|13.0
The fields are self-explanatory.
-
- Total Dist – Distance of the whole workout
- Total Time – Total duration of the workout
- Avg Pace – Pace of the workout in time per 500m
- Avg Pwr – The average power of the workout
- Avg SPM – The average stroke rate of the workout
- Avg HR – The average heart rate
- Max HR – The highest heart rate in the workout
- Avg DPS – The average distance per stroke.
Down below the total summary, you can see it repeated with curious SDist, SPace type descriptions. This section is for “Splits”. Splits are just sections of the workout. The definition of the splits can come from the data that you uploaded and it can be redefined by you using the Interval Editor on rowsandall.
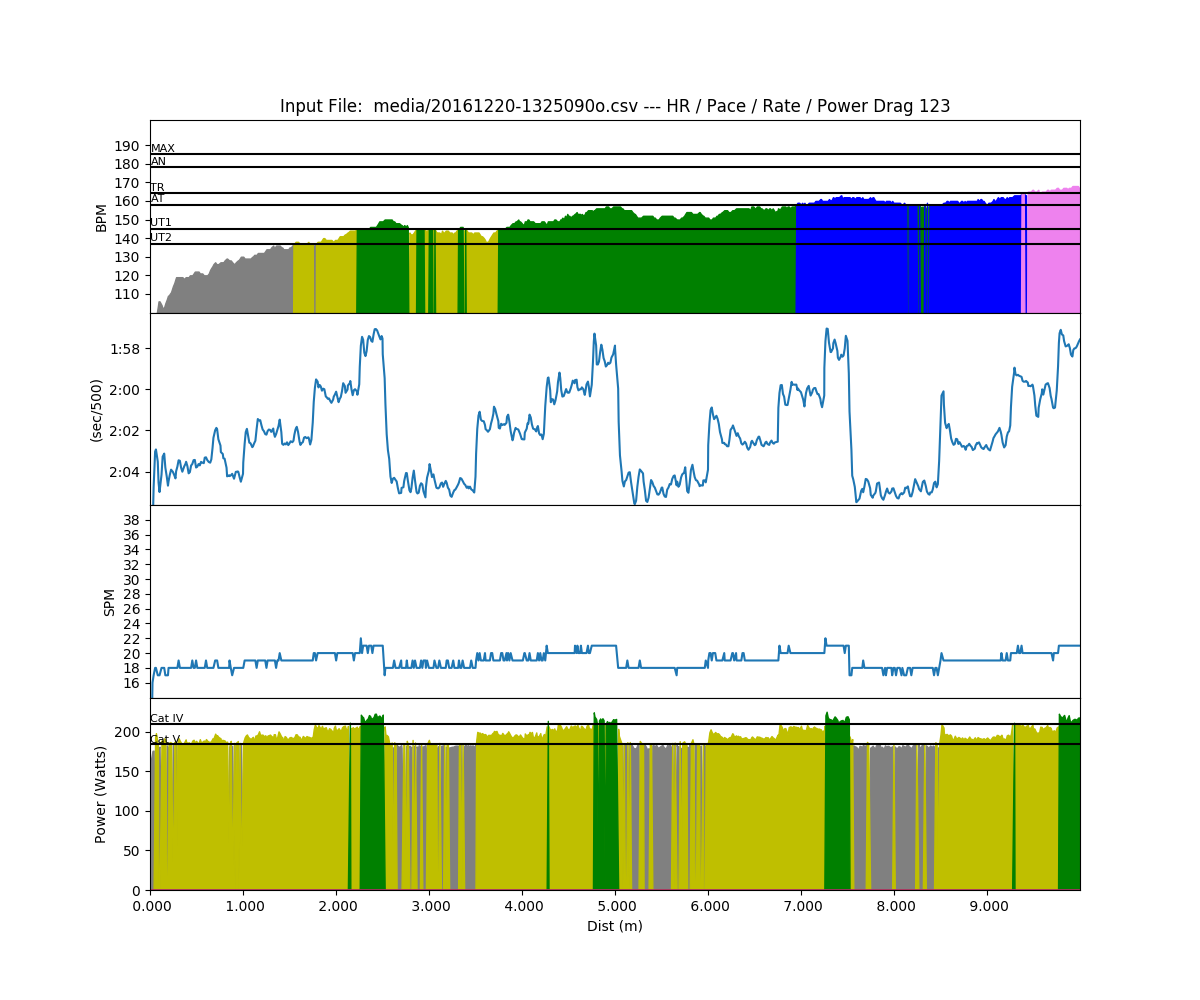
Let’s look more closely at this session. As you could see in the summary, it’s a 10K row.
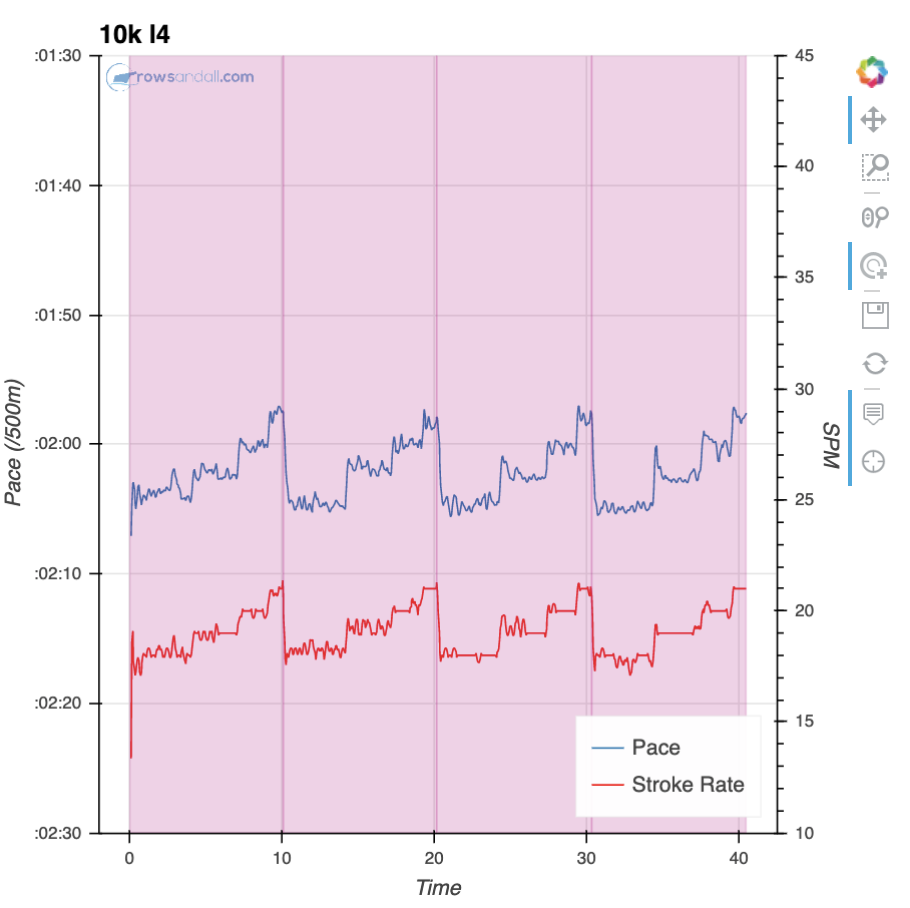
Here’s the summary distance chart from rowsandall. You can see that this work had 4 sections, each of them was 2500 long.
You can use the interval editor to look at summary statistics for each of the four sections.
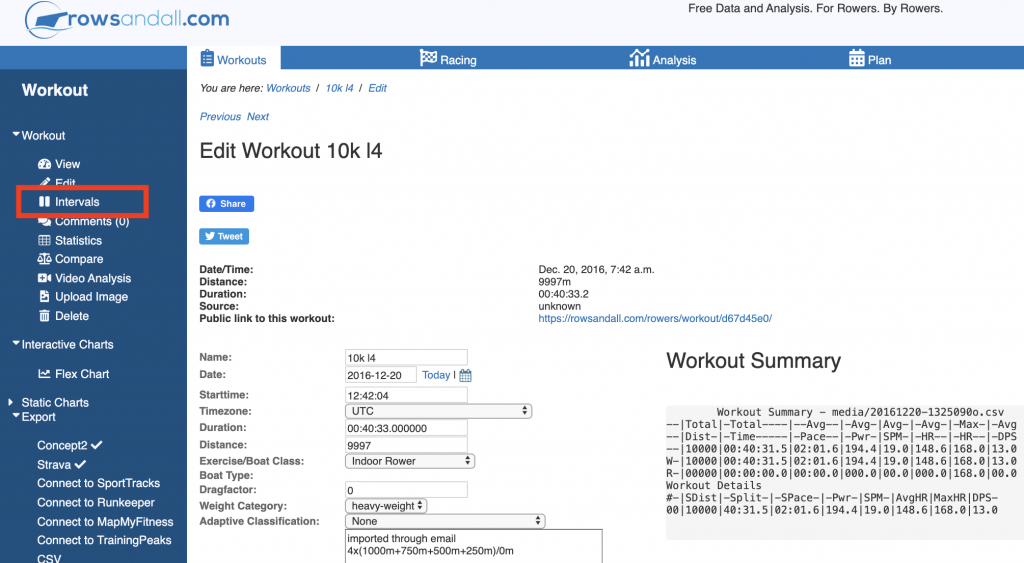
You get into the Interval Editor by choosing “Intervals” from the left hand menu.
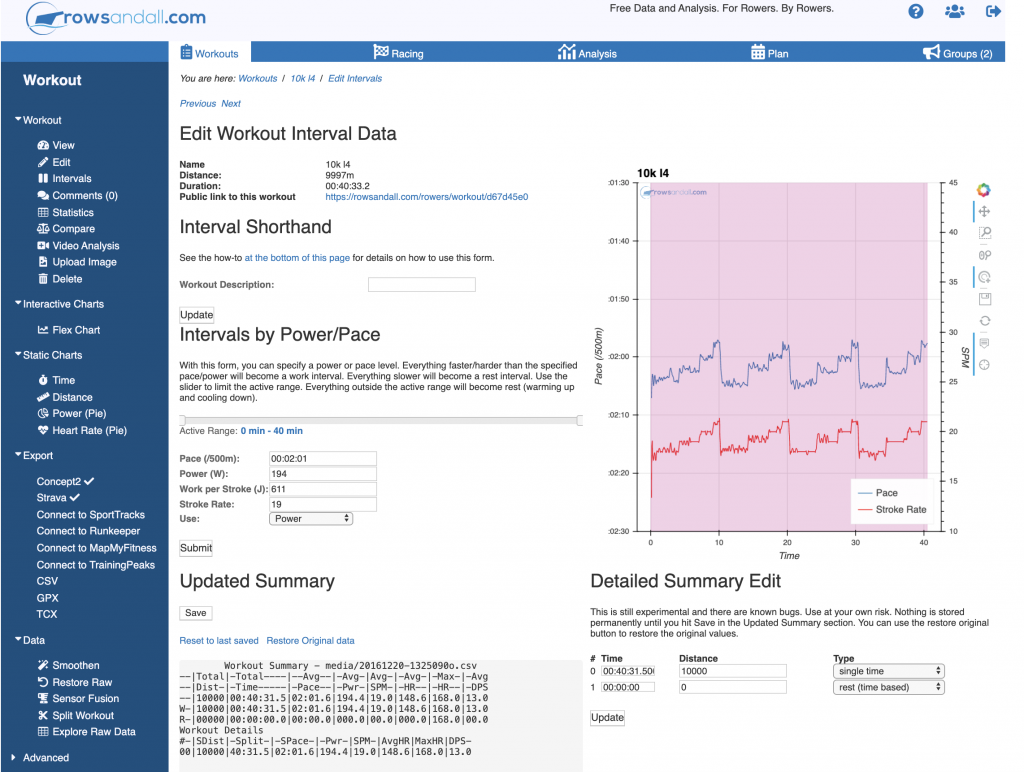
Which brings you to the interval editor page.
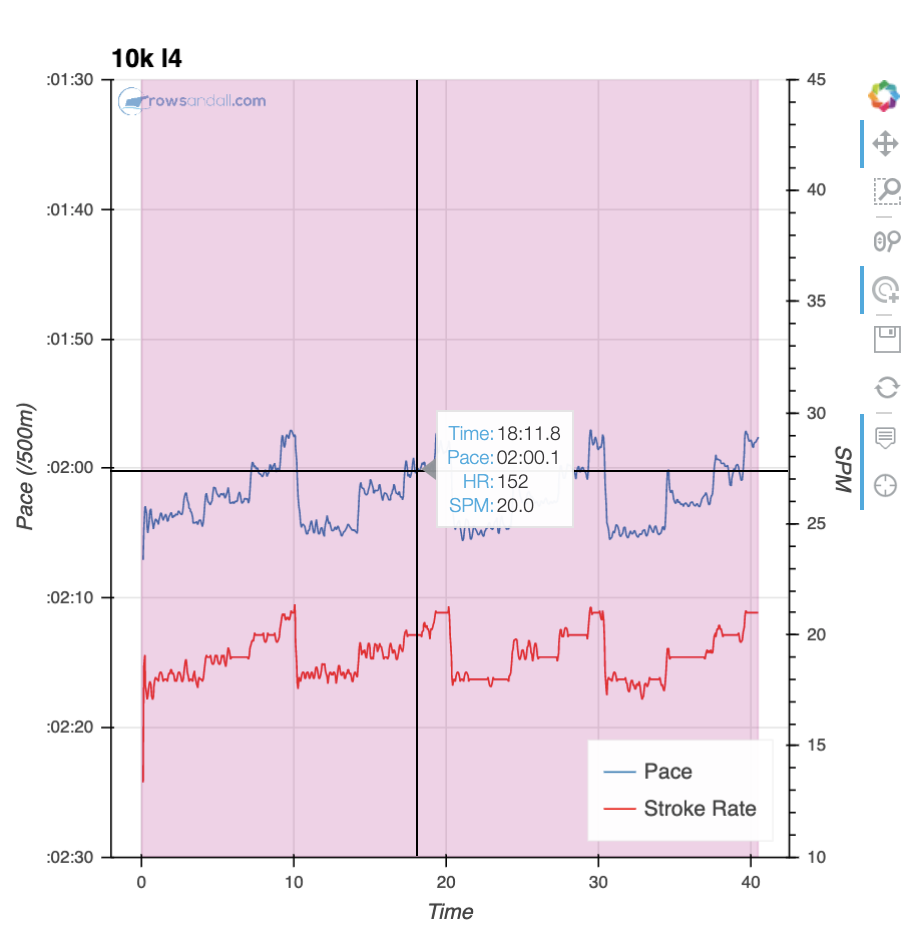
There is a lot going on here, so let’s take it in sections. The graph in the upper right corner is there to help you see where you want to define your intervals. Using the controls over along the right edge, you can pan and zoom on the data. The pink shading indicates “work” intervals. White is used to ahow a rest. When you put your cursor over the plot, it will show you more detail about the data points.
Down at the bottom of the right hand side is the text summary of the currently defined intervals. We are going to be modifying those in this example.
The way to do that is to use the box under the heading “Interval Shorthand”.
Down at the bottom of the page is an explanation of how workouts can be described. It’s terse, but understandable.
For example, the workout that I did was four 2500m intervals with no rest between them. So, in the Workout Description box, I can type:
Click the update button, and now the plot looks like this, with a line demarking each of the intervals.
and the summary section will update to look like this.
See, now there are 4 separate summary lines for each 2500m interval, so you can compare between sections.
You can continuously redefine the workout description. In this workout, the intervals were identical rate ladders, each with a 1000m, 750m, 500m and 250m section inside them. To look at the detail, you can redo your description.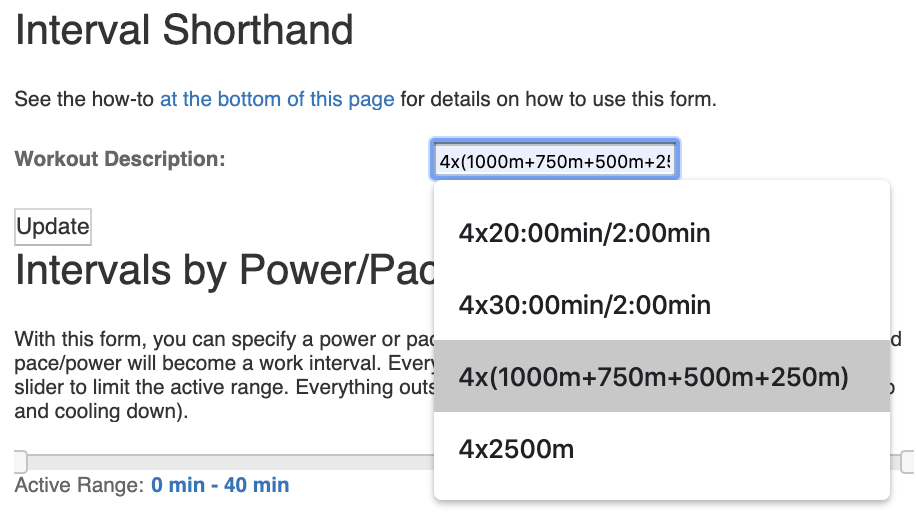 After you hit update, the summary look like this…
        Workout Summary - media/20161220-1325090o.csv
--|Total|-Total----|--Avg--|-Avg-|Avg-|-Avg-|-Max-|-Avg
--|Dist-|-Time-----|-Pace--|-Pwr-|SPM-|-HR--|-HR--|-DPS
--|10000|00:40:30.8|02:01.5|194.4|19.0|148.6|168.0|13.0
W-|10000|00:40:31.5|02:01.6|194.4|19.0|148.6|168.0|13.0
R-|00000|00:00:00.0|00:00.0|000.0|00.0|000.0|168.0|00.0
Workout Details
#-|SDist|-Split-|-SPace-|-Pwr-|SPM-|AvgHR|MaxHR|DPS-
00|01000|04:03.0|02:01.5|187.0|17.9|118.0|130.0|13.8
01|00750|03:03.9|02:02.6|193.7|19.0|134.2|138.0|12.9
02|00500|01:58.4|01:58.4|204.5|19.9|140.5|145.0|12.7
03|00250|01:00.2|02:00.5|217.6|20.8|146.2|149.0|11.9
04|01000|04:06.3|02:03.1|184.1|18.2|145.0|150.0|13.4
05|00750|03:03.3|02:02.2|195.8|19.3|145.7|150.0|12.7
06|00500|01:58.0|01:58.0|205.0|20.1|151.5|155.0|12.6
07|00250|00:57.5|01:55.1|213.4|21.0|156.0|157.0|12.4
08|01000|04:08.2|02:04.1|184.5|18.1|152.7|157.0|13.4
09|00750|03:00.8|02:00.6|193.5|19.2|154.8|157.0|13.0
10|00500|02:01.6|02:01.6|203.8|20.0|158.1|161.0|12.3
11|00250|01:01.3|02:02.7|215.9|21.0|161.4|163.0|11.7
12|01000|04:08.0|02:04.0|182.6|17.9|159.3|162.0|13.5
13|00750|03:02.2|02:01.5|193.2|19.0|160.0|162.0|13.0
14|00500|02:00.1|02:00.1|205.3|20.0|164.6|167.0|12.5
15|00250|00:58.7|01:57.3|216.2|20.9|167.1|168.0|12.2
See how each section has it’s own summary. Now you can compare all the 1000m sections to each other.
Defining Rest Periods
Up in the summary, there are two rows of data. One starts with “W” and the other “R”. The “W” row is the “work” summary, and the “R” is the “rest” summary. An interval based workout is usually defined by a work distance (or time) and a rest distance (or time). For example, here are the typical “Pete Plan” workouts written as the interval editor would expect them.
- 4x2000m/5min
- 5x1500m/5min
- 3000m/5min+2500m/5min+2000m/5min
- 8x500m/3.5min
- 4×1000/5min
- 250m/1.5min+500m/3min+750m/4.5min+1000m/6min+750m/4.5min+500m/3min+250m
After you do a few of these, it becomes second nature.
Intervals
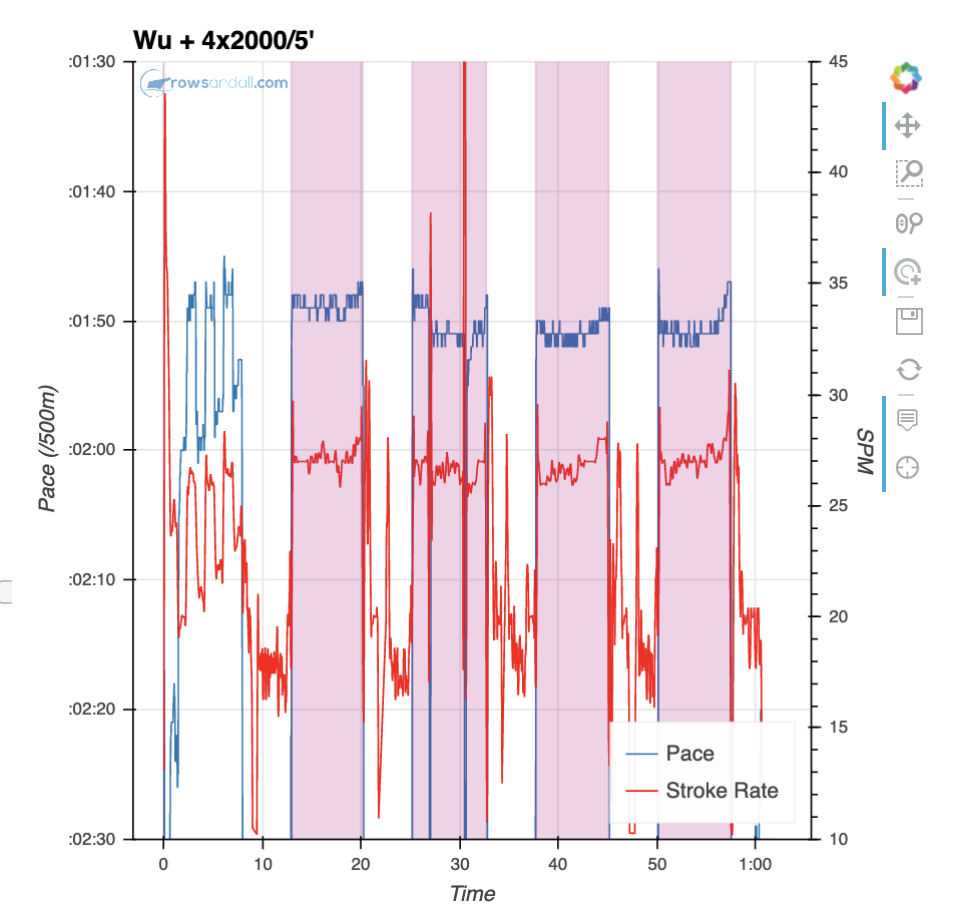
The interval editor also supports dividing a workout into work and rest periods so you can just look at summary statistics for the work. So, for example, if you are doing a 4 x 2000m workout with 5 minute rests, You will get a summary of your workout on the performance monitor.
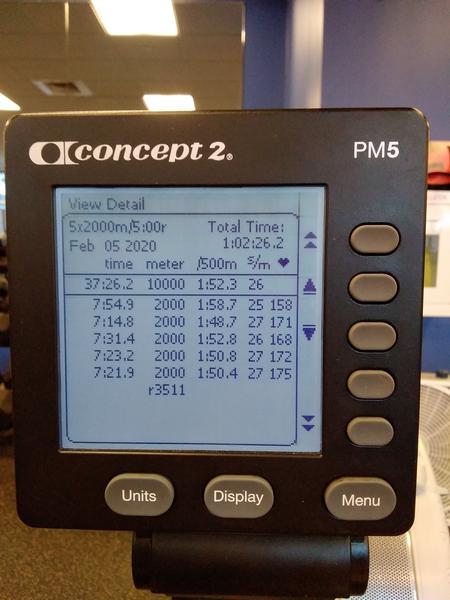
But in this case, I did the first interval as a warmup, so the summary stats don’t reflect the “real” work session.
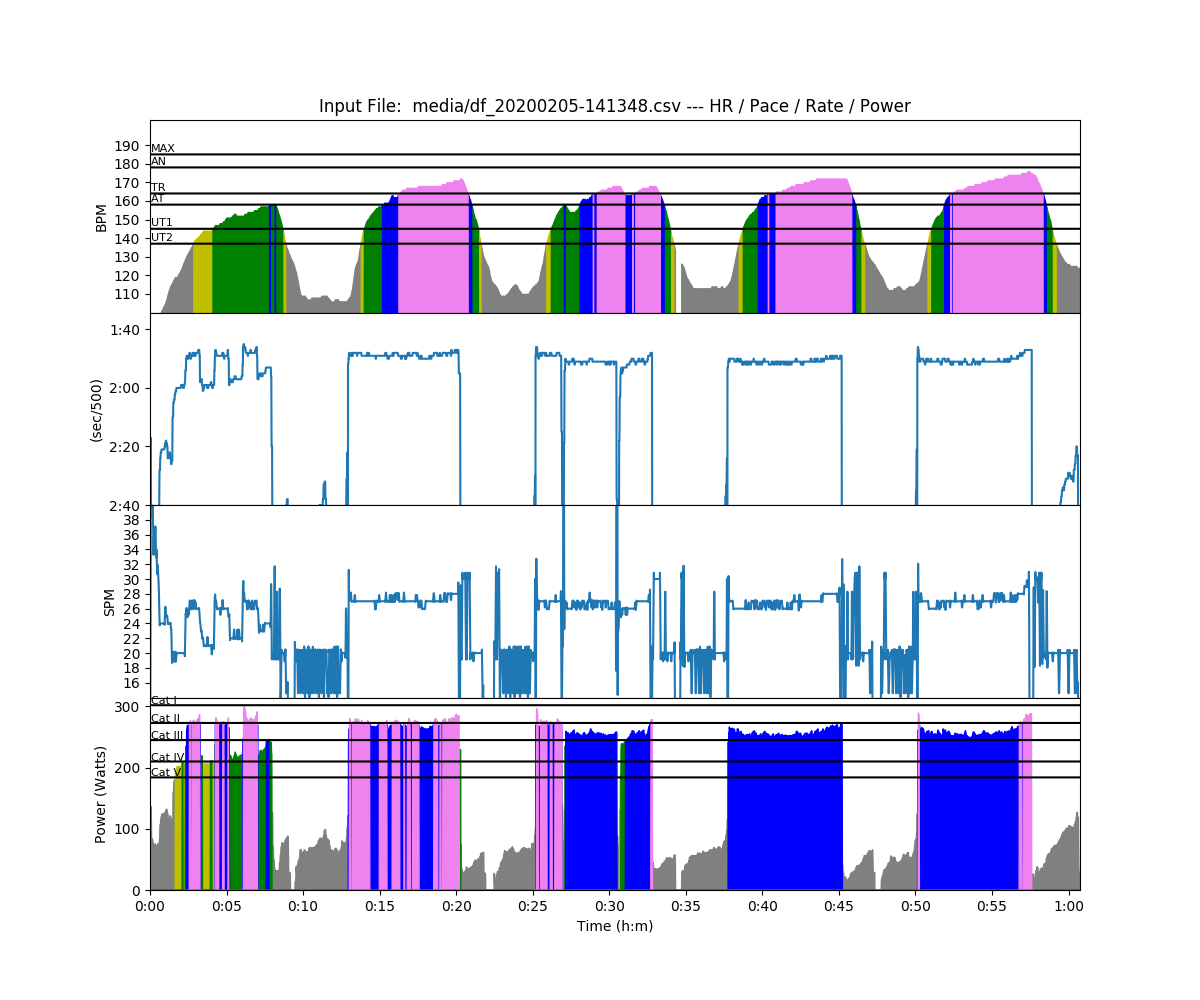
(Yep, you can see I had serious issues in the second interval. Some workout suck)
So, let’s use the interval editor to get some more accurate stats. To start out, there are no intervals defined in the data that was uploaded.
        Workout Summary - media/df_20200205-141348.csv
--|Total|-Total----|--Avg--|-Avg-|Avg-|-Avg-|-Max-|-Avg
--|Dist-|-Time-----|-Pace--|-Pwr-|SPM-|-HR--|-HR--|-DPS
--|13503|00:60:45.9|02:15.0|175.8|23.3|144.9|176.1|09.5
W-|13503|00:60:45.9|02:15.0|175.8|23.3|144.9|176.1|09.5
R-|00000|00:00:00.0|00:00.0|000.0|00.0|000.0|176.1|00.0
Workout Details
#-|SDist|-Split-|-SPace-|-Pwr-|SPM-|AvgHR|MaxHR|DPS-
00|13503|60:45.9|02:15.0|175.8|23.3|144.9|176.1|09.5
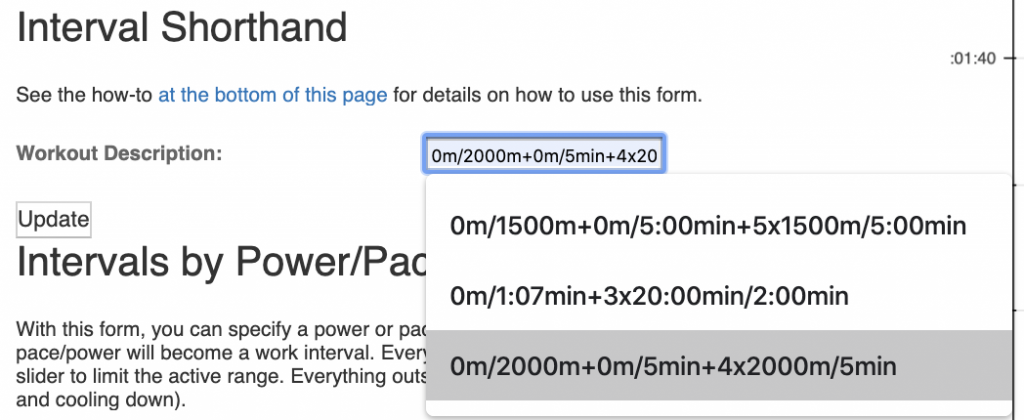
We can build a workout description that cuts off the first 2000m and next 5 minutes as a rest then parses the rest of the workout. To do that we use the following description.
Which changes the plot view to this…
And the summary shows the four actual intervals.
        Workout Summary - media/df_20200205-141348.csv
--|Total|-Total----|--Avg--|-Avg-|Avg-|-Avg-|-Max-|-Avg
--|Dist-|-Time-----|-Pace--|-Pwr-|SPM-|-HR--|-HR--|-DPS
--|13500|01:02:28.2|02:18.8|171.0|22.7|144.4|176.1|09.5
W-|08000|00:29:33.1|01:50.8|259.4|26.9|159.7|176.1|10.1
R-|05503|00:27:55.3|02:32.2|080.0|18.5|130.7|176.1|08.0
Workout Details
#-|SDist|-Split-|-SPace-|-Pwr-|SPM-|AvgHR|MaxHR|DPS-
01|02000|07:15.4|01:48.8|272.3|27.0|158.3|171.1|10.2
02|02000|07:31.5|01:52.9|249.4|27.1|157.4|168.1|09.8
03|02000|07:24.2|01:51.1|257.0|26.5|160.6|172.1|10.2
04|02000|07:22.1|01:50.5|259.4|26.9|162.8|176.1|10.1
Time Based Intervals
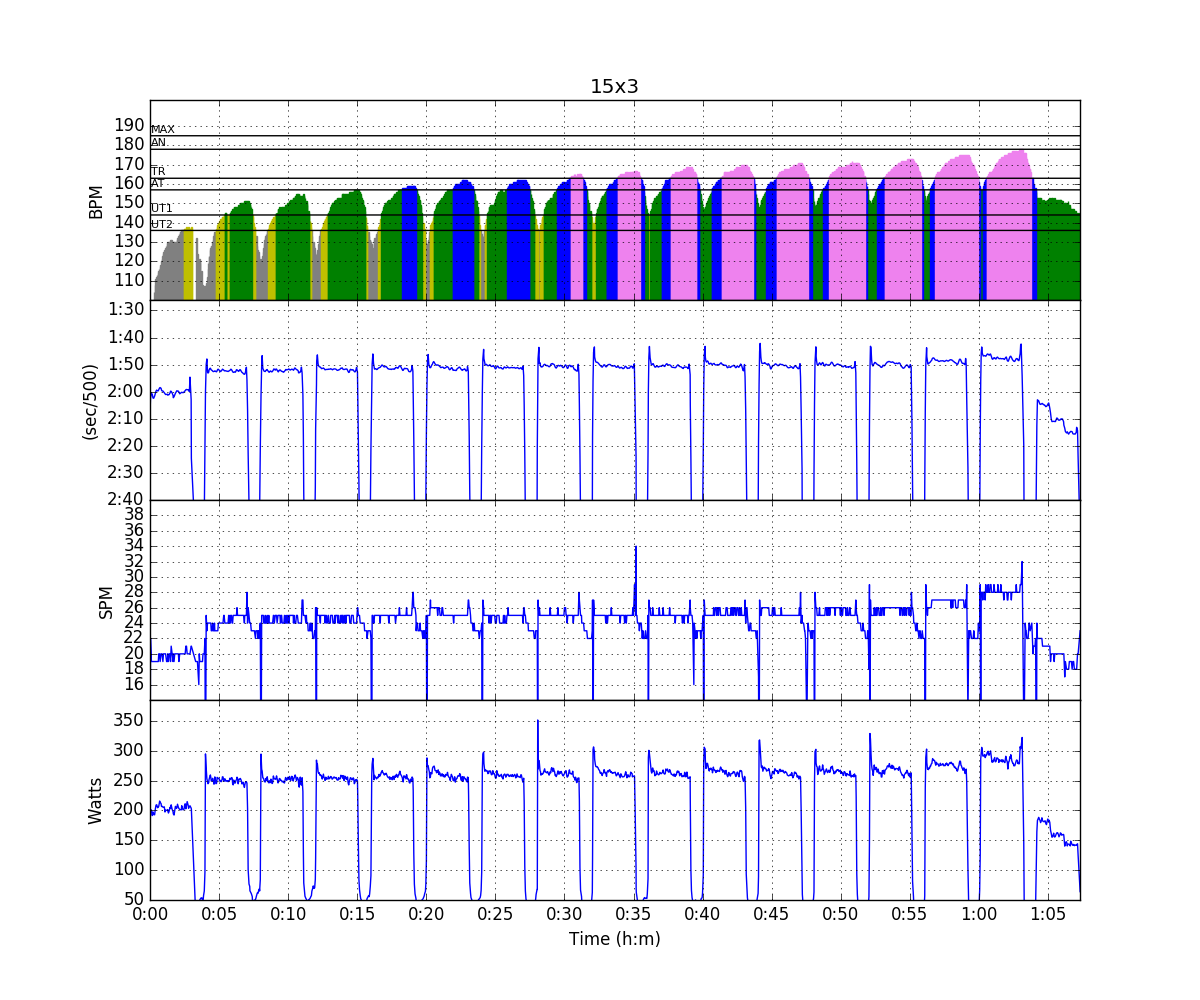
You can also define time based intervals, like I did for this classic Wolverine plan “L3” workout, the 15×3.
In this workout, I set up the PM for 3 minute work and 1 minute rest. I did the first and last intervals as warmup and cool down and I wanted to look at 15 in the middle. So, I defined the workout like this.
In english, that is
- start of with an interval with 0 minutes of work and 4 minutes of rest (the warmup)
- then 15 intervals of 3 minutes with 1 minute of rest after each
- then a 0 minute interval with 3 minutes of rest (to catch the cool down)
The resulting summary looks like this…
Workout Summary - media/20161103-135324-sled_2016-11-03T08-06-32ZEDT.strokes.csv
--|Total|-Total-|--Avg--|-Avg-|Avg-|-Avg-|-Max-|-Avg
--|Dist-|-Time--|-Pace--|-Pwr-|SPM-|-HR--|-HR--|-DPS
--|15500|64:00.0|02:03.9|215.2|24.3|155.4|178.0|10.0
W-|12210|45:00.0|01:50.6|260.7|25.0|157.1|178.0|10.9
R-|04048|22:19.0|02:45.5|105.4|22.3|150.3|178.0|11.3
Workout Details
#-|SDist|-Split-|-SPace-|-Pwr-|SPM-|AvgHR|MaxHR|DPS-
00|00006|00:00.0|00:00.0|165.5|00.0|80.0|80.0|00.0
01|00803|03:00.0|01:52.1|250.8|24.0|140.8|151.0|11.2
02|00817|03:00.0|01:50.2|252.3|24.2|145.1|155.0|11.3
03|00824|03:00.0|01:49.2|255.3|24.3|148.4|157.0|11.3
04|00815|03:00.0|01:50.4|257.4|24.6|149.9|159.0|11.0
05|00805|03:00.0|01:51.8|257.6|24.9|152.8|162.0|10.8
06|00818|03:00.0|01:50.1|258.7|24.5|153.9|162.0|11.1
07|00798|03:00.0|01:52.8|258.3|24.7|155.0|165.0|10.8
08|00802|03:00.0|01:52.2|259.7|24.6|158.3|167.0|10.9
09|00821|03:00.0|01:49.7|261.4|24.7|160.2|169.0|11.1
10|00815|03:00.0|01:50.4|263.9|25.0|162.5|170.0|10.9
11|00811|03:00.0|01:51.0|261.0|24.8|163.0|171.0|10.9
12|00803|03:00.0|01:52.1|260.3|25.2|163.6|172.0|10.6
13|00813|03:00.0|01:50.6|264.4|25.3|164.7|173.0|10.7
14|00834|03:00.0|01:47.9|270.2|26.3|167.5|175.0|10.6
15|00826|03:00.0|01:48.9|278.8|27.6|170.4|178.0|10.0
See the 0 minute interval at the start. The Work summary shows the total time of 45 minutes (15 x 3), and the rest is 15 + 4 + 3 = 22 minutes, the 19 seconds is the left over in the last rest before I pushed menu on the PM5 to finish the workout.
This is great because you can accurately compare the performance between similar workouts without worrying about data from the rests messing you up.
Irregular Intervals
The interval editor also works for time based workouts as well. For example, here is a workout that might be familiar to people that have used the Wolverine Plan. It is a Level 4 “L4” workout. In these workouts, you have specific power and stroke rate targets.
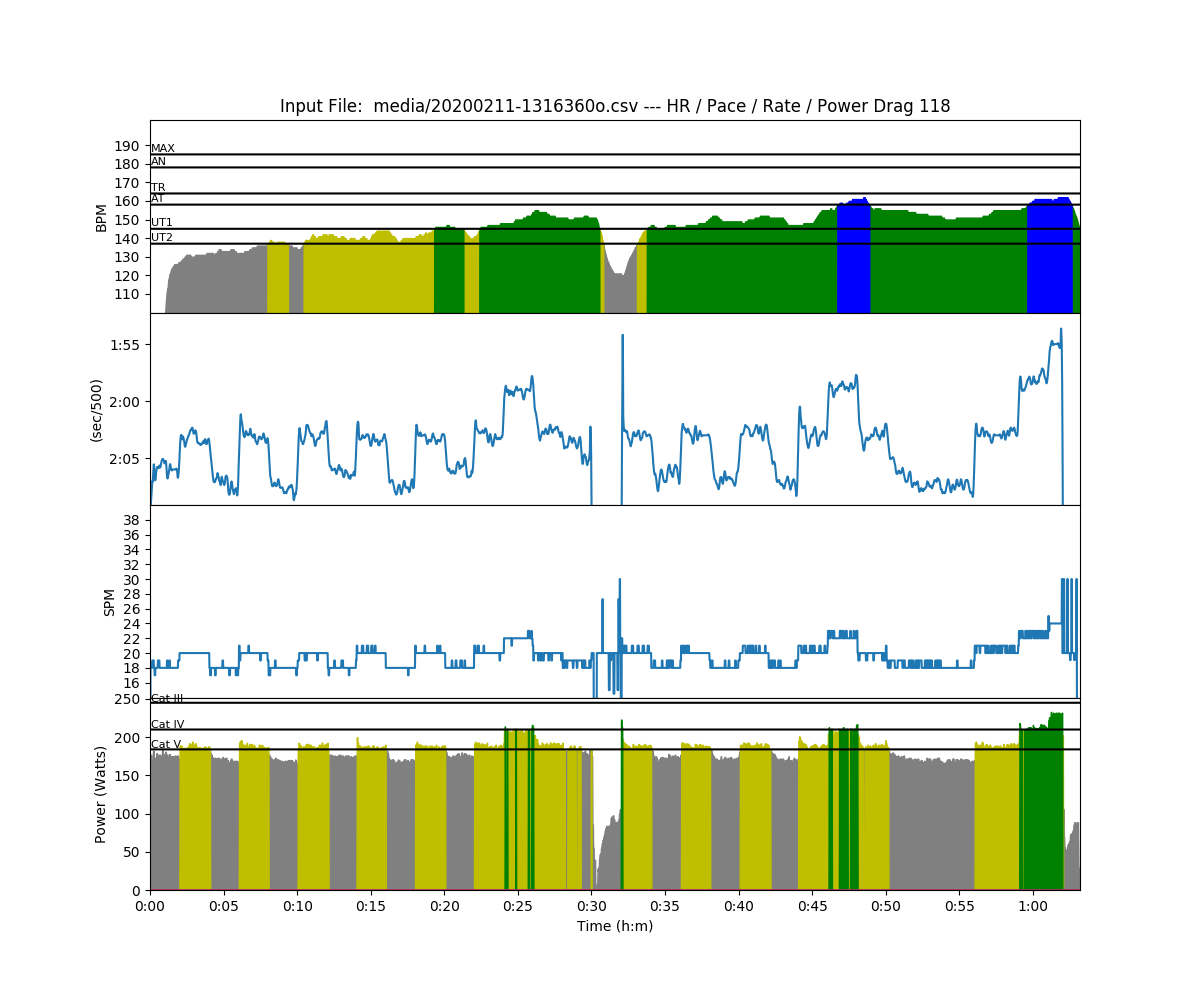
This specific workout was 2 – 30 minute pieces with a 2 minute rest between. Each piece was broken up into 3 10 minute sections. Then each 10 minute section was broken up into specific intervals with targets.
- Piece 1
- 1st 20 minutes: 5 repeats of 2′ @ 18spm and 2′ @ 20spm
- 2nd 10 minutes: rate pyramid 2′ each at 18, 20, 22, 20, 18
- Piece 2
- 18/20/18/20/18
- rate pyramid: 18/20/22/20/20/18
- rate ramp: 4′ @ 18, 3′ @ 20, 2′ @ 22, 1′ @ 24
So, lets say you want to see how closely you hit your power targets, which are:
- 18 spm: 160W
- 20 spm: 180W
- 22 spm: 200W
- 24 spm: 220W
This is where the interval editor comes to the rescue. You just need to split up the workout into slices with the interval editor.
Here’s the workout description:
15x2min+0m/2min+10x2min+4min+3min+2min+1min/2min
Let’s take it piece by piece
- 15x2min: 15 intervals of 2 minutes with no rests
- 0m/2min: a 2 minute rest with no work period
- 10x2min: 10 intervals of 10 minutes each
- 4min+3min+2min+1min/2min: The rate ramp at the end with 4,3,2,1 minute work intervals, and then a 2 minute rest at the end to pick up the extra meters of the last rest.
When you input the description, you can check to see if the intervals are divided where you want them.
The summary of this is something beautiful! Most of it is divided up into 2 minute sections, but the last 10 minutes is divided 4,3,2,1.
       Workout Summary - media/20200211-1316360o.csv
--|Total|-Total----|--Avg--|-Avg-|Avg-|-Avg-|-Max-|-Avg
--|Dist-|-Time-----|-Pace--|-Pwr-|SPM-|-HR--|-HR--|-DPS
--|15056|01:03:12.7|02:06.0|178.9|19.5|144.9|162.0|12.2
W-|14543|00:60:00.0|02:03.8|184.7|19.6|145.1|162.0|12.4
R-|00526|00:03:12.7|03:03.1|070.7|18.4|142.0|162.0|09.0
Workout Details
#-|SDist|-Split-|-SPace-|-Pwr-|SPM-|AvgHR|MaxHR|DPS-
00|00483|02:00.0|02:04.2|174.8|18.0|098.7|127.0|13.4
01|00486|02:00.0|02:03.4|187.0|20.0|130.4|132.0|12.2
02|00473|02:00.0|02:06.8|171.0|17.9|132.8|134.0|13.2
03|00488|02:00.0|02:02.9|188.0|20.0|134.4|137.0|12.2
04|00471|02:00.0|02:07.5|169.6|18.0|137.0|139.0|13.1
05|00487|02:00.0|02:03.1|188.0|19.8|139.1|142.0|12.3
06|00477|02:00.0|02:05.8|175.5|18.1|140.4|142.0|13.2
07|00486|02:00.0|02:03.4|187.1|20.2|141.4|144.0|12.0
08|00471|02:00.0|02:07.3|170.0|18.0|140.4|144.0|13.1
09|00488|02:00.0|02:02.9|187.5|20.1|143.4|146.0|12.1
10|00476|02:00.0|02:06.1|175.9|18.2|144.1|147.0|13.1
11|00488|02:00.0|02:02.9|188.3|20.1|145.9|148.0|12.2
12|00504|02:00.0|01:59.0|207.5|22.0|149.9|154.0|11.5
13|00489|02:00.0|02:02.7|191.5|19.8|152.9|155.0|12.3
14|00485|02:00.0|02:03.8|183.2|18.7|150.9|152.0|13.0
15|00490|02:00.0|02:02.5|189.7|19.9|134.4|146.0|12.3
16|00475|02:00.0|02:06.3|174.0|18.3|146.1|147.0|13.0
17|00487|02:00.0|02:03.2|188.3|20.1|147.3|150.0|12.1
18|00476|02:00.0|02:06.2|172.7|18.2|149.9|152.0|13.1
19|00488|02:00.0|02:03.0|189.3|20.3|150.3|152.0|12.0
20|00474|02:00.0|02:06.5|172.5|18.2|149.3|152.0|13.0
21|00488|02:00.0|02:03.0|188.8|20.3|150.1|155.0|12.0
22|00507|02:00.0|01:58.4|208.4|22.3|158.0|161.0|11.4
23|00488|02:00.0|02:03.1|189.8|19.9|157.8|162.0|12.2
24|00475|02:00.0|02:06.3|175.2|18.6|154.7|155.0|12.8
25|00941|04:00.0|02:07.5|169.2|18.2|151.4|153.0|12.9
26|00734|03:00.0|02:02.7|188.5|20.5|153.7|155.0|11.9
27|00507|02:00.0|01:58.3|211.4|22.4|158.9|161.0|11.3
28|00261|01:00.0|01:55.1|228.7|24.2|161.1|162.0|10.8
Conclusion
The Interval editor is one of the more powerful features on rowsandall, and especially useful if you want to track progress on the same workouts over a long season. There are some other features of the interval editor that are very powerful for on the water rowing and to make splitting up irregular workouts even easier. Stay tuned!

