
Why Analyze?
To go faster. We analyze rowing to go faster. Apart from very big technique flaws which may cause injuries, the bulk of rowing analysis is for the purpose of going faster. We want to be as efficient as possible with the power and strength limitations that we have, whether it’s on the erg or not. On the water, there is also the aspect of matching your rhythm and technique to that of the other rowers, in order to be as efficient as possible as a crew. But still, we want to go as fast as possible. As a consequence, we should also ignore any “technique flaws”, deviations from a golden standard that do not have negative impact on boat or erg speed. A static erg is more forgiving in this respect than a boat or a dynamic erg, so On The Water (OTW) rowers should be more critical regarding their technique than pure indoor rowers.
Video analysis has been a part of rowing since film was invented. Coaches look at rowers and tell them what their flaws are. The interesting thing is that when you are busy doing a rowing stroke, it is very hard to tell how it looks. Look and feel are definitely not in sync, especially for rowers who have already rowed many rowing strokes and have ingrained technique flaws.

Also, seeing is believing. It is one thing to be told by your coach that you have a funny shoulder bob that reduces your efficiency, but before you really start to work on it, you probably want to see it from the coaches’ perspective. So since the beginning of modern rowing, video analysis has been part of the deal.
In the beginning, rowers looked at their shadows projected on a steep bank, or perhaps there was a mirror mounted somewhere along the canal, but with the advent of affordable camcorders, video analysis has been part of the deal.
A good coach’s eye is still the basis, but with digital video easily available and computer processing power of today, the coach’s observations can be enhanced by measuring key parameters of the rowing stroke. And there we are in an interesting situation that there is no consensus yet in the rowing world on what are the key parameters. Part of the mission of rowsandall.com is to help figuring out what works and what doesn’t. And with that mission in mind, it would be stupid to not look at what other people have done.
Row Analysis is a Dutch company that offers video analysis of your erg stroke. The idea is very simple. You upload a video of 10 strokes on the erg to their site, make a payment, and Row Analysis converts your video to useful data. A few days later you get your report with values of important parameters, compared with the relevant benchmarks. Recently, I have been through this process, and it was really as simple as that.
Row Analysis: The Process
Before you row
Before you start capturing a video of your erg rowing, you have to study the information on the site. The video can be captured with any smartphone or camcorder. According to the site, the process takes about 20 minutes. I think it took me closer to 30 minutes, but part of that was because I forgot to take scissors to the rowing club. It really pays off to read the documentation in advance, because the site describes very well what you need to do, what material you need to take, how you should row (stroke rate 30spm, not higher, not lower).
There are also very handy videos that illustrate the process.
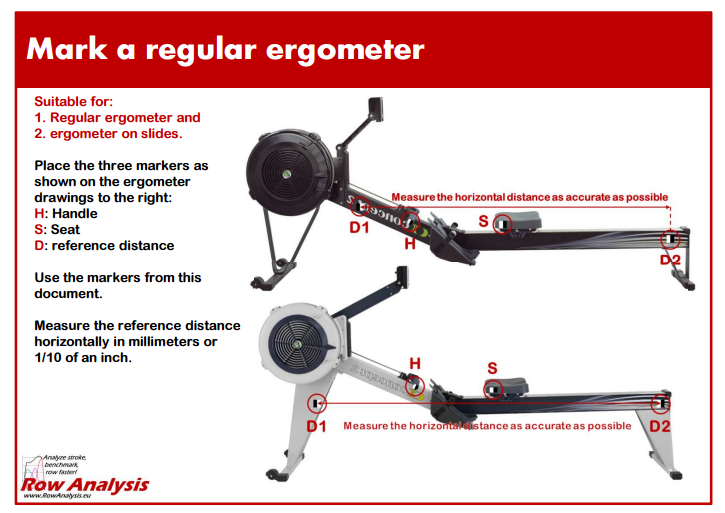
You download and print a PDF document containing black/white markers. You need to cut out the markers and then attach them to the erg and to your body using tape. It is also important to not forget a tape ruler to measure the distance between two key markers (necessary to convert video to stroke length and drive speed).
It is possible to do this alone (like I did) but it is better if you have a buddy who assists. And I repeat, check the handy checklists. I forgot the scissors and lost valuable time at the club, and I left the ruler in the car, so I had to go out and run to the parking lot in my rowing clothes, with outside temperatures well below the freezing point.
The Row
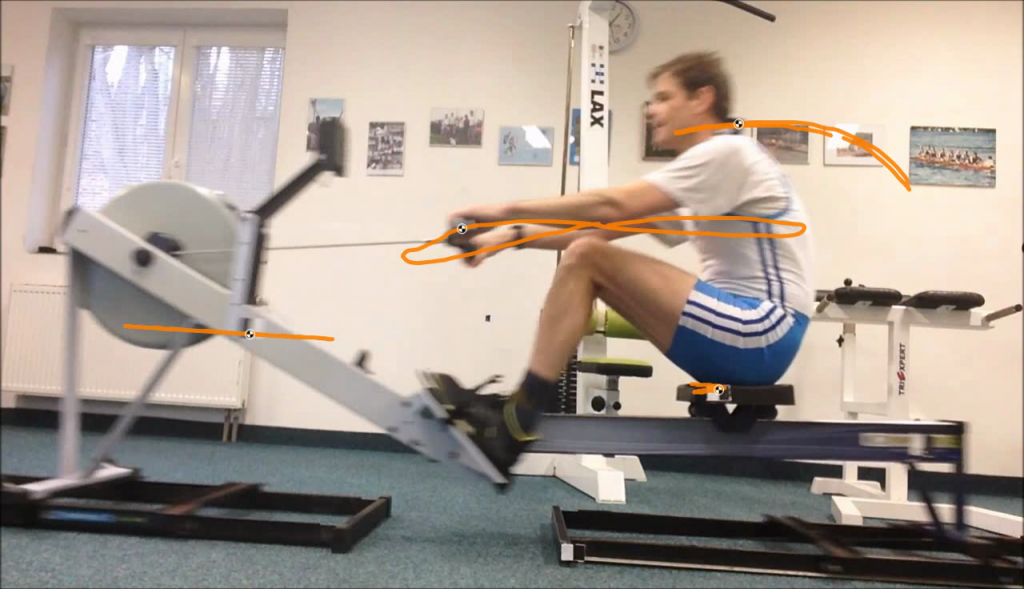
The actual rowing is disappointingly short. There is a 75MB limit to the video file and they ask you explicitly to not upload more than 10 strokes (of which 5 are used). I used the iPhone front facing camera, and most time was needed to get the camera fixed on the right angle and distance from the erg, such that all markers were in the field of view for the entire 10 stroke sequence, which I did by doing practice strokes and looking at the iPhone screen. I was a little worried that the front facing camera wasn’t high quality enough, but it turned out to be OK.
When I was happy, I pressed “record”, hopped on the erg, rowed for a minute, hopped off the erg, and pressed “stop”. Later, I edited down the video to have only 10 strokes at 30spm. I also measured the distance between the two markers on the erg frame, and I noted down the split that I pulled. During the row, I tried to keep the split at 1:44, which is my 2k Personal Best pace. There were no instructions other than “row at 30spm”, but I figured this would be a good value.
Being busy with the setup and making sure that I did everything according to the instructions took my focus away from rowing with good technique. I guess I recorded my “standard” stroke, with no conscious effort to demonstrate good technique. In principle, this is not bad, because this is also how you row when you’re getting tired. Still, I would recommend to others to have a helper, so that the rower can focus on the rowing.
After the row
After cutting down the video to 10 strokes, I uploaded it to the site, went through the payment part, and submitted the analysis request. The payment part was special, because I was given the analysis as a present. I used the voucher code that I had and everything was very straightforward.
During the upload process, you have to choose two benchmarks to compare your stroke to. The options are:
- Same sex and weight
- Same sex and length
- Same sex and age
- Mean of own team (not applicable in my case)
- Best of own team
- Average of my field (Masters C in my case)
- Best of my field
- Other (please specify)
I chose same sex and weight and “best of my field”. I didn’t want to compare with the average. Here, you are dependent on the samples that Row Analysis have in their database, so the more people use the service, the better.
In my case, “best of my field” was a person rowing a 1:27 split (a Masters C rowing a 2k below 6 minutes?) and with a significantly longer stroke. I know I have a short back for a rower, but this person must have been a rowing giant. I don’t know how many Masters C rowers Row Analysis have in their database, but it would make more sense to benchmark against, say, the top 10% of my field. (I did actually share this comment with the site owner, who will take this on board as valuable feedback.)
Also, in hindsight, I may have chosen “same sex and length” as the second benchmark. Many of the metrics are derived from the stroke length, and if you benchmark with a different sized rower, you may end up seeing differences that you cannot correct.
Row Analysis: The result
The site says that it takes up to five working days to generate the report, but I had it in the email on the same evening. You receive two files. The first one is this video
The Report – metrics
The second file is a PDF report. A front page with a video still from your video and 7 pages of very high information density.
A nice personal touch is a personal summary written by Jeroen Brinkman, the owner of Row Analysis. In my case, he gave three tips:
- At the catch, I grab a little with my arms. When the legs start to move, the arms cannot hold the force and I stretch my arms again. I should work on eliminating this and start the stroke with legs only.
- At the start of the recovery, I should bring back my back earlier and faster.
- At the end of the recovery, I slow down on the slide too early. I could gain boat speed by continuing a constant speed for longer.
The first point is very obvious from the video. The other ones are less easy to see but are clear from the benchmarks in the rest of the report.
Jeroen also offers a phone consultation where he explains in more detail the advice he gives. I think this is extremely cool. Now, for any rower, expert advice is just a few clicks away. I will definitely take him up on this offer, and discuss some of the questions I have on the report.
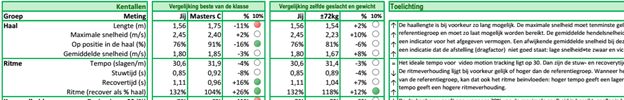
The rest of the first page lists your results and benchmarks for 32 metrics in 8 groups (Stroke, Rhythm, Catch, Finish, Power, Legs, Back, Arms), including explanatory remarks. This dashboard also has traffic light type indicators (green if you are more than 10% from the benchmark in the “good” direction, red if you are more than 10% from the benchmark in the “bad” direction). This makes it easy to spot weak and strong points in one glance. Interestingly, when compared with the “best Masters C”, I was worse on almost all metrics, and only better on recovery, rhythm, and the position of maximum leg force. Compared to the average male of my age, I was better on a few metrics, worse on a few others and neutral on most. In both benchmarks, I see a few strange values. For example, the speed of arms away (defined as the percentage of total recovery time it takes to move the handle 10cm away from the release) was 10% for me, but 95% for the benchmark. Probably a data (or motion tracking) glitch, and when I reported this to Jeroen he promptly responded that he will look into it.
My stroke length was 1.56m, which was low compared to my “Best Masters C” benchmark of 1.75m, but on par with the same age/sex benchmark. Really, how big do you have to be to have a stroke length of 1.75m? I guess reaching for 1.75m also explains why this benchmark is pulling 1:27.
I am also wondering how much the drag setting affects the metrics. At low drag, your drive speed will be higher, drive duration shorter and this affects at least 4, but probably 10 of the 32 metrics.
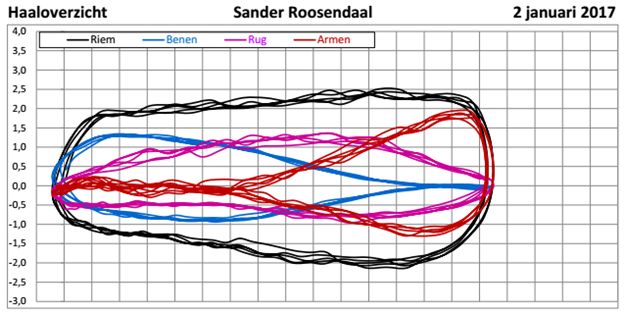
O diagram
Page 2 of the report shows two “O diagrams”. The top one is my own O diagram and the bottom is a “best in class” one.
An “O diagram” is a graph of handle (arm, leg, trunk) speed plotted as a function of the position in the stroke. To me, this is the most useful graph of the entire report.
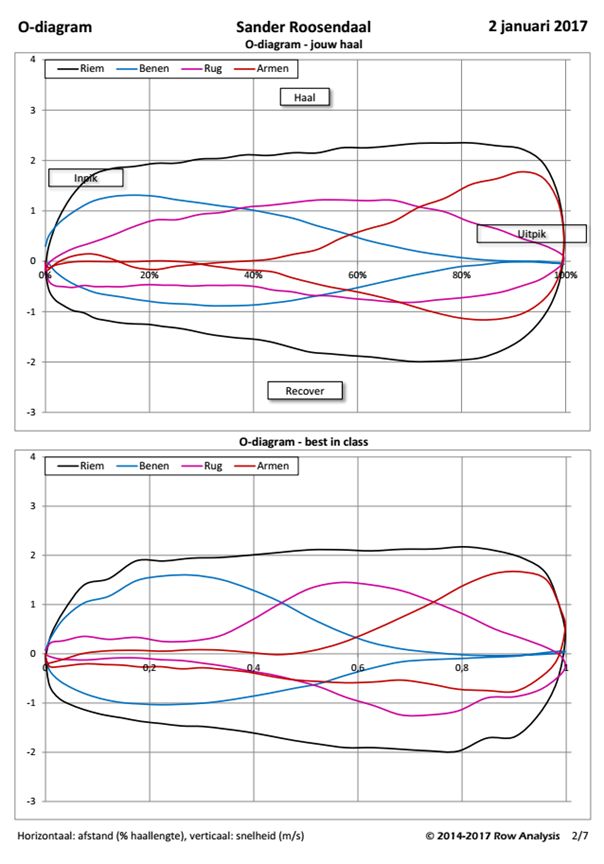
Looking at my arm speed in the top graph, there is a wiggle during the drive, where I grab pressure with the arms, then the arms stretch again when the legs take over the pressure. Looking at my trunk movement, it is moving during the entire stroke. I agree that the “best in class” curve (second graph) is better. It shows nicely how I should be rowing, starting the back swing later.
Page 3 contains explanations on how to use the O diagram, as well as another very interesting graph:
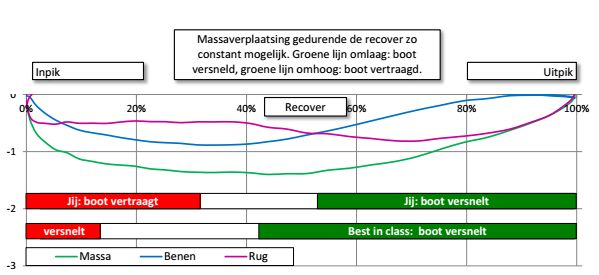
This one is a zoom in of the recovery part, again with “uitpik” (release) on the right and “inpik” (catch) on the left. I apologize for the Dutch language (I ordered the report in my mother tongue), but what you see is the velocity of your center of mass, trunk and legs during the recovery. If your center of mass accelerates or decelerates, the boat will do the opposite, and that is what the green and red bars are about. So basically, the boat acceleration part is shorter than “best in class”, while the boat deceleration part is longer. I should be pulling more on the stretcher for a longer time during the second part of the recovery.
Personally, I would like to model the impact of the different parameters, and get a feel for how serious this is.
Page 4 is a spider web diagram on 10 metrics, where my values are compared with my two benchmarks, as well as 6 reference rowers. I guess this diagram is more useful when used to compare technique differences between members of the same crew, where a coach can see which is the metric with the biggest spread of values. That metric should probably be the first one to work on and improve.
Pages 5 to 7 show graphs for the five individual strokes. Here is an example, showing handle and leg speed:
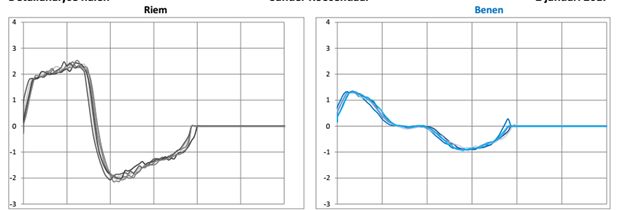
This one is good for looking at stroke consistency. I think I was pretty consistent. That also shows from the individual O diagrams for the five strokes:

Conclusions about my technique
Looking at the data and the graphs, I can only agree with what Jeroen wrote in the summary. I am surprised at how large my arm grab is. I spent some time thinking about this. Is this something that slows me down or not? I am not 100% sure, but on the water it may also lead to dipping the blades too deep, and it seems worth trying to improve this. The other aspect to work on is to emphasize sequencing leg-trunk-arms during the drive and arm+trunk/legs during the recovery, trying to keep constant recovery speed as long as possible before slowing down into the catch.
Except for the arm grabbing these are exactly the points I have been working on during the past OTW season. I may have become a bit sloppier during the erging in the winter.
Conclusion
Row Analysis is well worth the money. For a basic analysis of 50 EURO you get a valuable independent opinion on your technique, based on sound metrics, and some clear suggestions on potential improvement points. As a bonus, Row Analysis offers a personal explanation of the report by phone. How good value for money is that?
What is missing is a quantification of the impact. I would really like to know how much faster I will go (at same effort) when I manage to row perfectly according to Best In Class technique, and I would value a breakdown of the speed difference according to my major technique flaws. Every second of pace improvement counts, but it would be nice to know what are the quick wins and what is fine tuning.
The process of making the video and ordering the analysis is well thought out and any hiccups I had during the execution were due to me not exactly following the instructions.
I feel that the benchmarking suffers a bit from a small sample size effect, but the only way for this to improve is getting more people to do the video analysis. The bigger Row Analysis becomes, the more valuable it gets. To be honest, this is where I feel is the real potential. Anybody can use video analysis software (for example https://www.kinovea.org/ ) to do motion tracking, but the cool thing about Row Analysis is that it has already defined the metrics, and is building a database of strokes, so you can be benchmarked, plus the personal advice from somebody who understands rowing.