Since June 8, rowsandall.com has a cool new feature that can help you to row the fastest race on the water. So what is it?
It is basically using your past rows to determine how fast you can go, for how long. The site will analyze your rows, find the fast segments, and analyze them for average power versus time.
For example, imagine you did a training consisting of a 250m piece, a 500m piece and a 1000m piece, and lots of paddling in between. Not only will the algorithm find those three pieces, but it will also find shorter segments that you rowed at a higher average power than the piece itself. And if you didn’t go full out in the 250m piece, it will find the fastest 250m that was part of your 1000m piece.
Actually, it works with time rather than with distance, and with power (Watts) and not with pace, because we don’t want our analysis to be influenced by tailwind or headwind. And it searches across all the workouts that you have marked as ‘ranking’. Across those workouts, we find for you the fastest (eh, highest power) 10 seconds, the fastest 11 seconds, the highest power over 3 minutes, 20 minutes, one hour, etc.
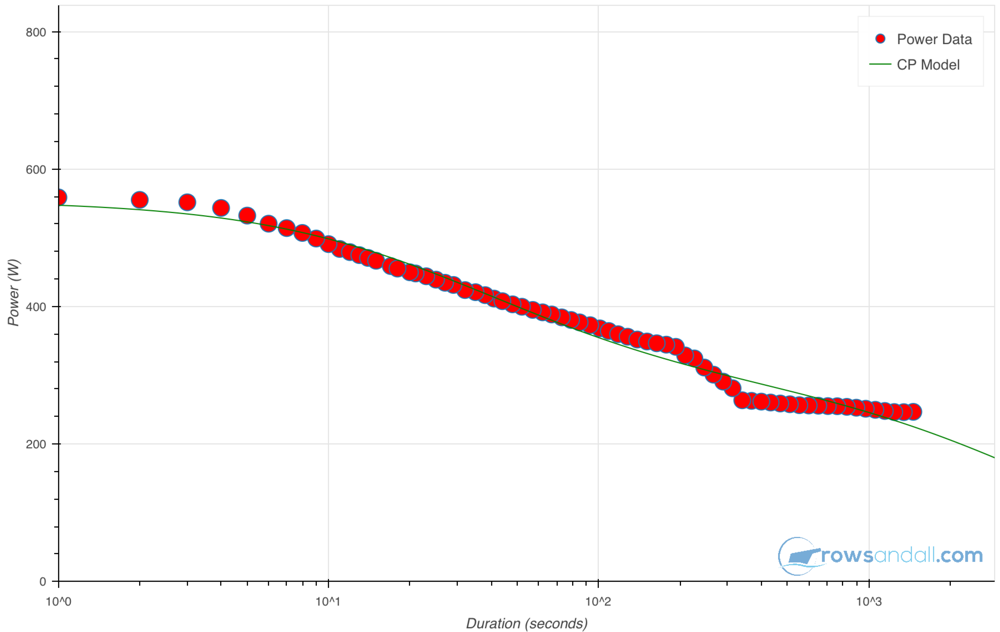
The result is something like this:
In this plot, every red dot is a segment in one of your workouts. On the site, you can hover over the dots with your mouse pointer and see a callout with the duration and the power.
The blue line is a fit to the data, using a physiological model that has proven to be be pretty good in modeling short anaerobic efforts as well as longer aerobic efforts. It may be a little off in the sprints that are shorter than 20 seconds, but in rowing those are hardly relevant.
So how to use this chart? You can use it to determine the power you can hold in a race. Now, we usually race over a fixed distance, so you will have to start by estimating the time it will take you to row the race, taking into account the wind conditions and the current. For example, I row a 1k race somewhere between 3:40 and 4 minutes. According to my chart, that puts me between 300 and 320 Watt. And if I have a power meter in my boat, I should be rowing in that ballpark, and not go out at 400W, because I will fly and die and fade away to 250W, and the average pace will be slower than if I hold a steady power.
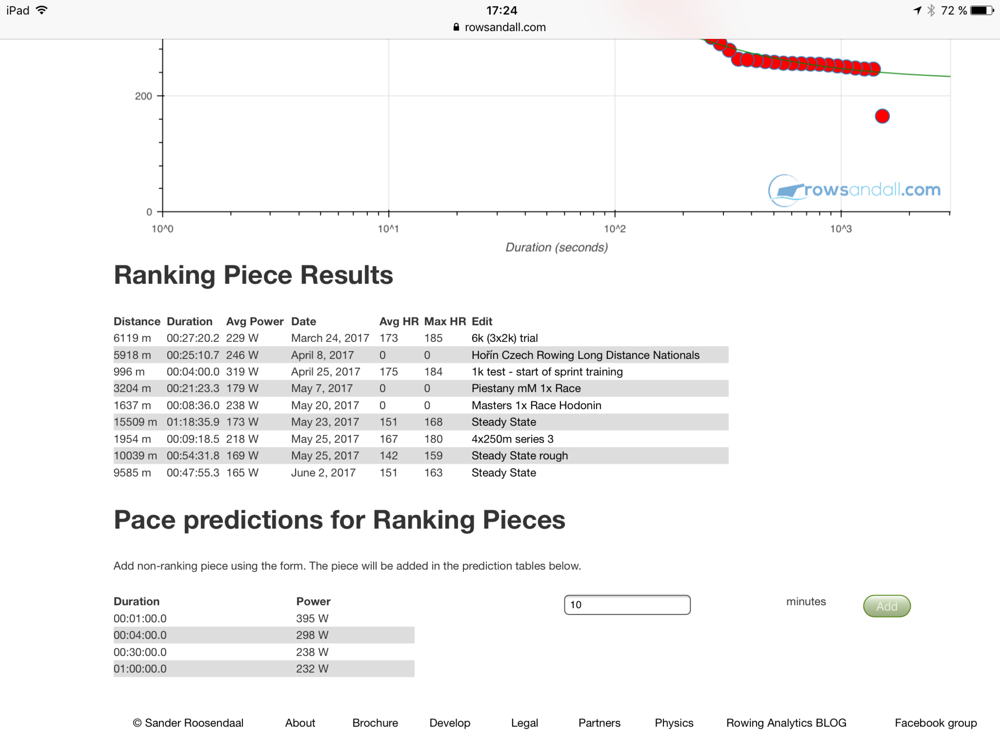
Actually, the site can do all that for you. Below the graph it lists the workouts that it used, and below that there are predictions:
So how can you start doing this? It’s easy. If you don’t have it yet, register at rowsandall.com and upgrade your account to the Pro version for the ridiculously low sum of 15 EURO (at the time of writing, prices may change) per year. Once you have Pro activated, you can start marking your key workouts and races as ranking workouts. I recommend to mark workouts that contain maximal effort segments. If you mark submaximal workouts, the algorithm will do a lot of useless processing on those workouts without actually finding any fast segments.
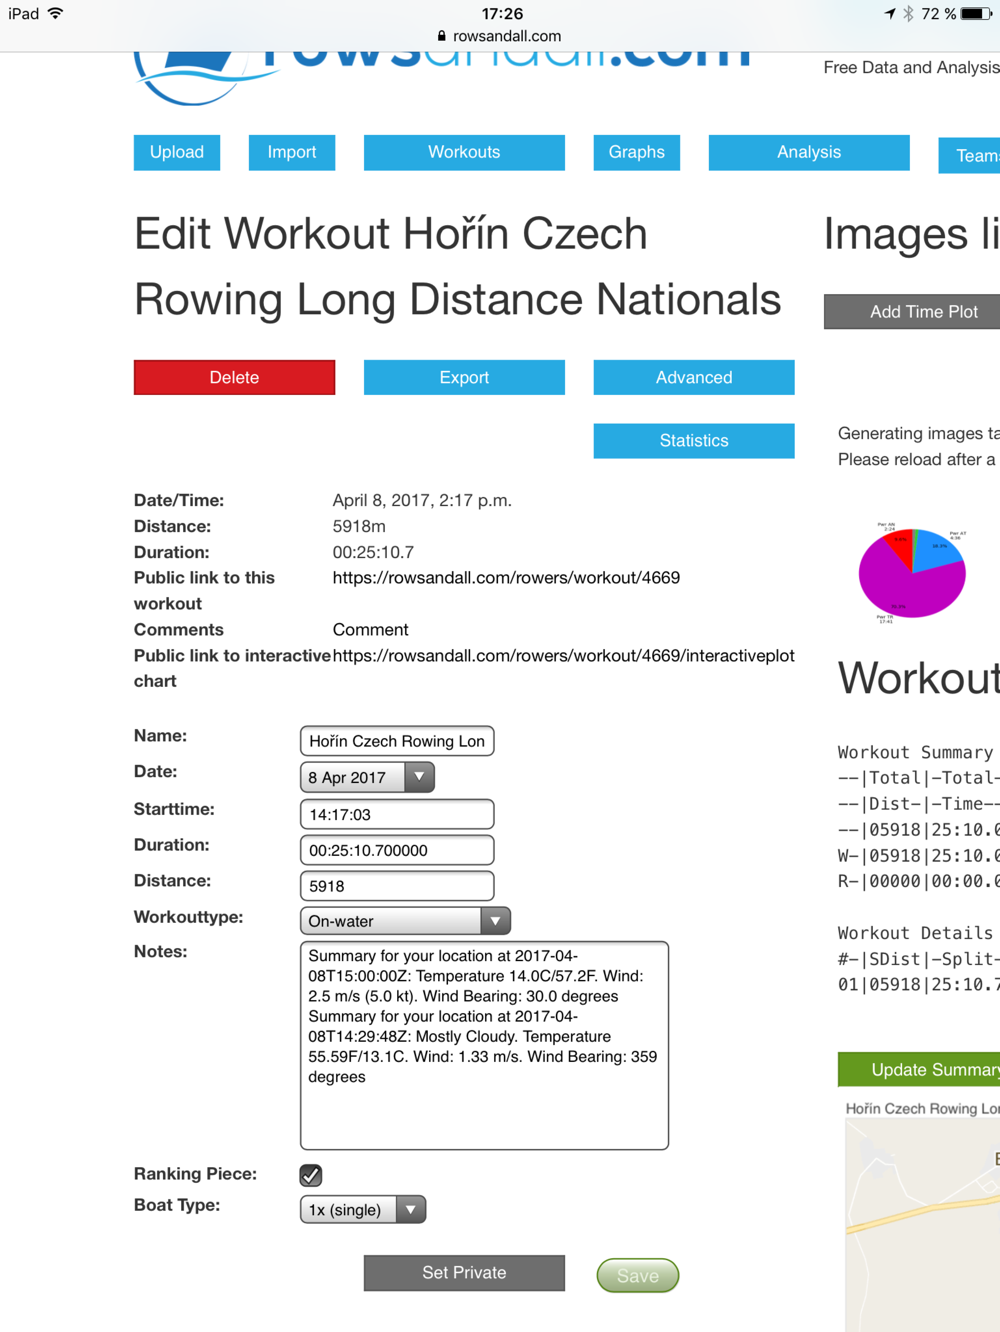
You mark those workouts in the workout edit form:
You can get to this form by clicking on the workout name in the workout list that you see after logging on to the site. All you have to do is tick the ‘Ranking Piece’ check box and hit Save.
After that, you surf to: https://rowsandall.com/rowers/otw-bests/ and there you will see your CP plot. You can also get to that page through the Analysis link at the top of every page on rowsandall.com. Coaches can browse through the CP plots for all their team members.
At rowsandall.com, we like to remove the guessing from the racing.


