
This article explains how to work with Force Curves and In-Stroke Analysis on Rowsandall.com.
These types of analysis look at the dynamics of your stroke and can be used on the water and on the indoor rowers. Examples of useful analysis are handle force or handle speed from catch to finish, seat speed during the stroke cycle, and more. Boat speed and acceleration during the stroke cycle are studied by many coaches and rowing scientists.
On the water, the Empower Oarlock can capture the handle force during the stroke, among others. The Quiske sensor system can be used on the water and on the indoor rower to capture seat speed, handle speed, and more. There are more solutions on the market. Every modern smartphone has several motion sensors, so it is possible to develop a smartphone app to capture these in-stroke data easily.
The analysis on Rowsandall is basically a two-step process:
- Perform an analysis of your in-stroke data on a single workout. You can focus on certain stroke rates, sections of the workout, or other. This is necessary because in-stroke data are strongly dependent on the stroke rate and boat speed, so you want to look at the average for selected parts of your row. Once you have found a set of strokes that is meaningful for your analysis, you can save this as a separate analysis. In this way, you can always find back your work.
- Compare two or more analyses in one chart. If you want to compare how your force curve looked at 32 spm between two of your 2k races, you simply select the two respective analyses and compare them in one chart.
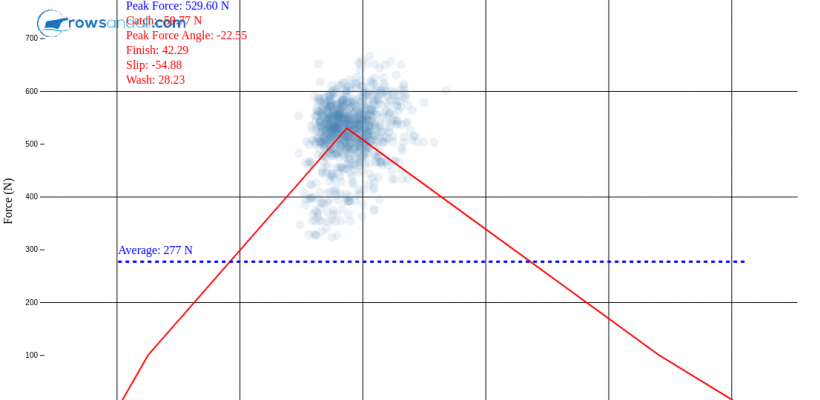
Let’s look at an example for the force curve created with an Empower Oarlock.
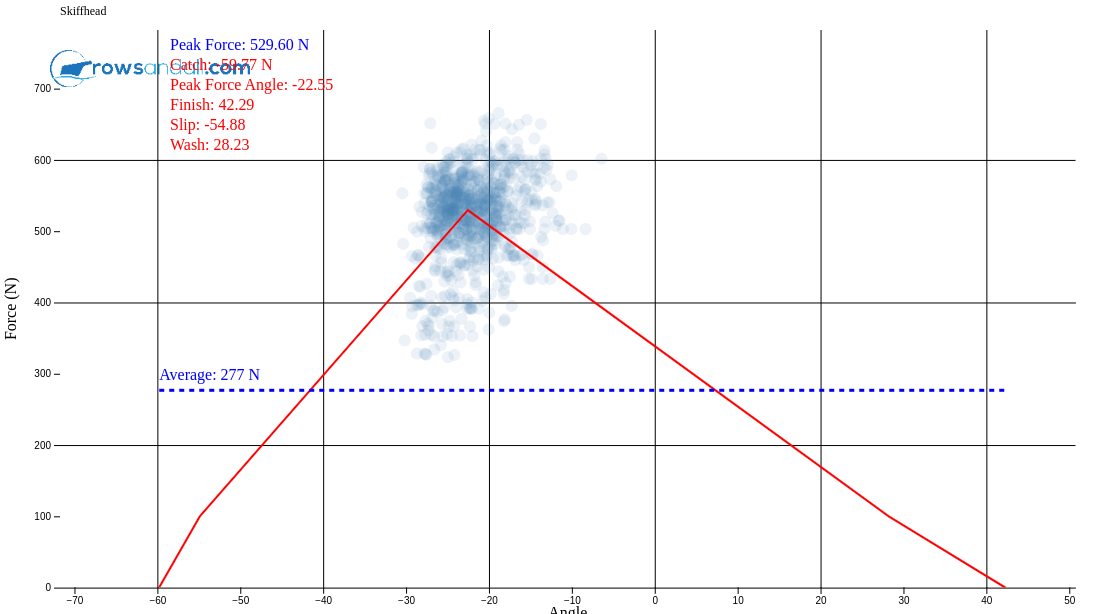
The picture shows the Force Curve analysis for all strokes between 27 and 29 spm for a certain race, measured using an Empower Oarlock. I create this force curve by opening the workout in Rowsandall, and then selecting “Force Curve” in the left panel. By using sliders for stroke rate and interval distance, I can select the exact group of strokes that I am interested in. When I am happy with the selection, I give the analysis a name and hit the Save button.
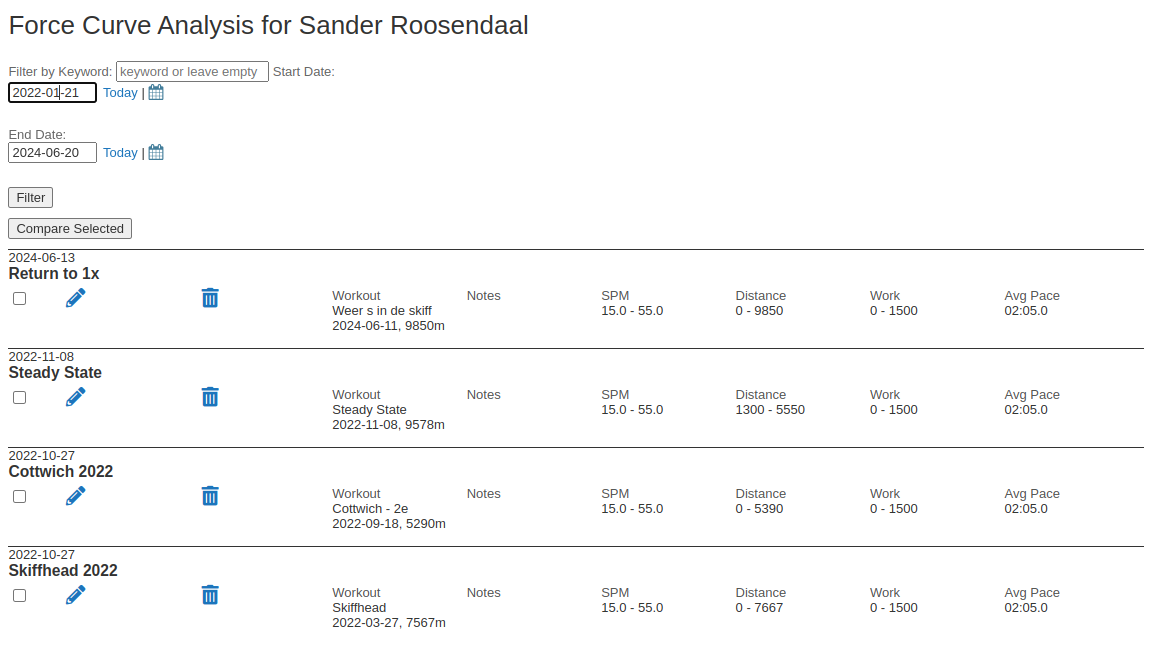
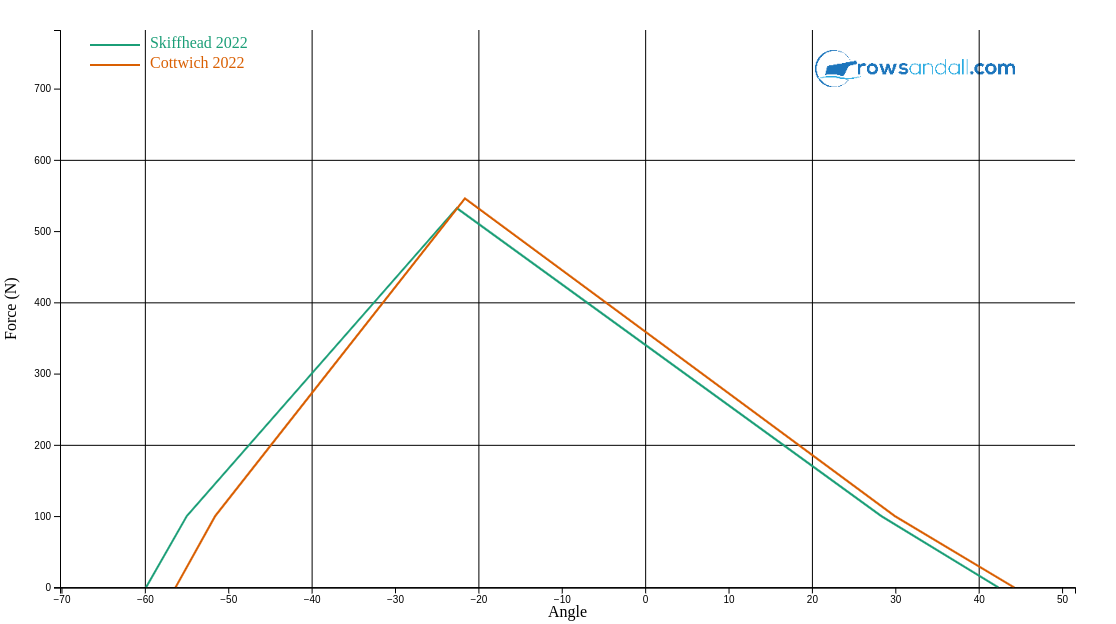
On the Force Curve Analysis page on Rowsandall (Analysis – Force Curve Analysis), I can look at the list of all the analyses that I have created. By selecting two analyses and hitting the “Compare” button, I can create a force curve comparison chart like this:
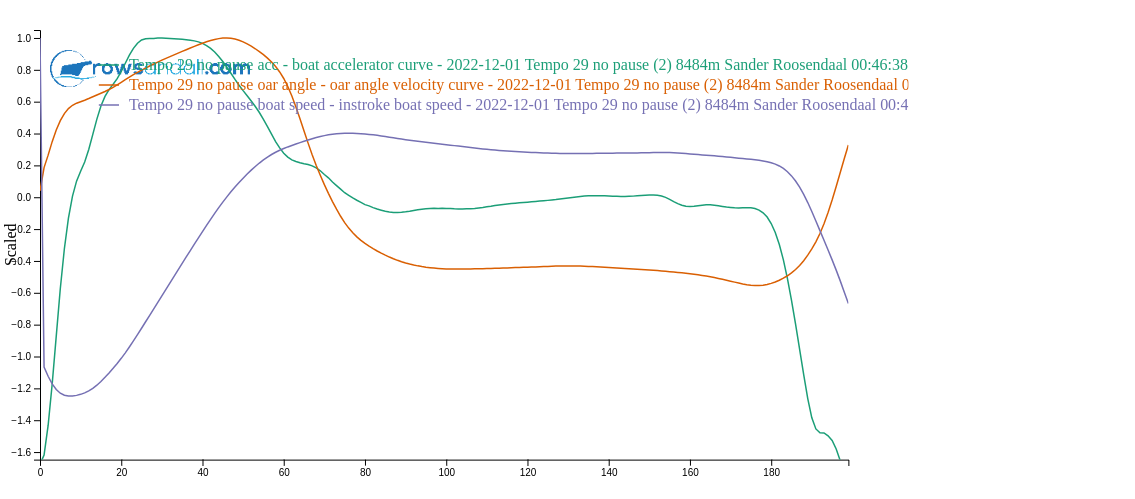
Similarly, I can use the Quiske sensors to measure boat acceleration, oar angle velocity and boat speed, and compare them, like this:
If you want to go beyond the chart abilities of Rowsandall, it is always possible to download a CSV with the data used to create the charts and use your own analysis program to create your own further analysis.