
22
- February
2017
Comments : 2
Making rowing data actionable
If you have some time, I really recommend you read this blog post. It is not about rowing but it is about running. Running and cycling are very much ahead of rowing in terms of the number of gadgets you can purchase and the number of metrics to track.

There are a couple of very good observations in the article:
- Consistency of data across devices
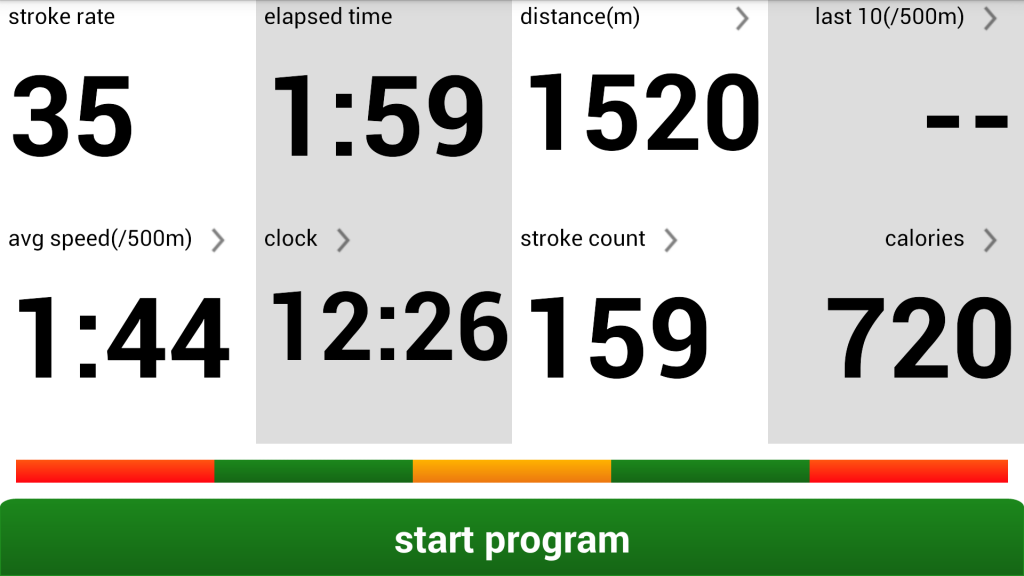
- This is something where rowing is going to struggle as well. The Empower Oarlock gives you catch and finish angles, slip, wash, power, average and peak force and a few other parameters. The erg will give you (handle) drive length, average force, peak force, drive time, and a few other parameters. CrewNerd gives you “check” and “bounce” and Rowing in Motion gives you “drag efficiency”, “catch duration”, “catch slope” and a few others. Rival companies will give you yet another set of metrics when they bring out their products, and the Concept2 is not the only erg brand.
- Hoping that the different manufacturers can at least agree on elapsed time, stroke rate, heart rate and elapsed distance (and we have seen discrepancies here), can we even compare something simple as “power” across devices? Is rowing at 200W on the Empower the same as rowing at 200W on the erg? Is it the same as 200W in rowsandall.com’s physics module that estimates power from your pace, stroke rate, and head or tail wind?
- Eventually we, the rowing community, will have to settle down on a common definition for those metrics. We will have to agree on how to measure a catch angle, and we should demand, at some point in time, a unified approach across the different manufacturers. If my club is rowing with NK gear, but in the next boat house they are using another brand, how am I going to compare data between them? And why couldn’t erg users unite and demand that all different erg brands measure power and “distance” in the same way?
- Data collection and accessibility of data
- This problem is very clear from DC Rainmaker’s review of running data gadgets. Trying to compare data across the six devices, he ends up with the data in six different places, and basically the only thing he can do is compare screenshots. The various websites are all very slick in different ways, but why on earth can’t he just export the data to a FIT, TCX or CSV file, and use basic excel to plot? Apps come and go. In two years, we will use a different app, and every time we switch, we draw a line and start collecting the data in a different place.
- On top of that, each gadget/website or gadget/app combo does data averaging, smoothing, and other manipulation in different ways. So even if we forget that the absolute values of the metrics are different, we cannot even see the same trends across devices.
- For rowing, I would advocate for a stroke based standard. At every stroke, the data logger should log time, distance, heart rate, pace, stroke rate, power, and all the other metrics. And they should be a simple time average over the duration of the stroke (if it is a continuous parameter), or the distance/time at the start of the stroke, or the raw value of the metric. All devices should have the same setting, allowing the user to chose how many strokes to average over for the data value displayed on the screen, so I can get the same averaging and responsiveness between different devices. The export to a CSV, FIT, TCX or other file should give raw, per stroke values, though. Let the data analytics app (or website) do the smoothing, averaging, and other data mangling, so that it is always done in the same way.
- What do the data mean?
- If we would do the two previous steps, we are finally at a point where it becomes interesting. I love to think about the details of how to measure and how to process the data, but I bet you want to know what it means. Should I work on increasing this metric or decreasing it? What does average/peak force ratio actually mean? Why has Marlene a different value for that metric than I? What does she do differently? And does it mean she rows better?
- In the end of the day, we are interested in just a few things. We will never organize rowing events where the prize goes to the crew with the fastest catch. Getting faster at the same intensity (rowing more efficiently), and getting faster overall (by achieving a better training result). I am convinced that it is possible to achieve this and use rowing data to improve technique, improve the way we train, and prevent overtraining, undertraining and injuries. But we are not there yet. And we need to improve on the first two points, mentioned above, before we get there.
- In the end, I believe we will settle on a few metrics. I bet that “distance per stroke” will be one of them, but I am not sure that “stroke rhythm” (or drive/recovery ratio) will be among the meaningful data. And right now, that is just my opinion, and we need clinical studies and much more data before we can see the trend.
- At rowsandall.com, we will implement as many metrics as possible initially, but we will look very closely at what metric is correlated to boat speed and what metric is not. Personally, I am very wary of metric fads, but I am afraid we will go through them as well. At one point we may think that “wash” is what we all need to monitor, only to realize later that wash doesn’t correlate to boat speed very much. (Sorry “wash” for picking on you. I guess it is just because I like the name if that metric. Wash. Wash. Wash.)
- How actionable are the data?
- Finally, we need to translate data into action. It is nice to track 10 different metrics over time. If you are lucky, you may even be able to show that you are improving. But all that is not worth much if we don’t know what we are doing wrong and how to improve it. What does “check” or “slip” mean? What exactly should I do differently in my rowing stroke to go faster, and can I check if I am doing it right by monitoring “check” or “slip”? Or should I look at something else? How do I use the data to check which of my athletes are at risk of overtraining, and how do I adapt his individual training plan based on the data I have at hand? Does he need more rest between sessions? Or shorter sessions? More intense sessions?
- We will always need smart coaches and scientists to help us. Also here, we are just at the start of a very interesting journey. The coaches’ eye can see subtle things and pinpoint to the exact place during a session where a rower’s technique broke down. We have to go to the data and see what is going on at that point in time. Then we need to give feedback to the rower, keep monitoring the relevant parameters, and see if that leads to improvement.
These are just a few thoughts on a Wednesday morning. While you are probably reading this because you enjoy playing with your rowing data, at rowsandall.com we are doing our best to advance on the four points above as well, and we will reach out to anyone who can help us with achieving that goal.