
In this part, I will be looking at the US Rowing Age Handicapping system.
There are couple of other articles on line that have looked at this topic and both of them are well worth a read. A couple of years ago, Carlo Zessa compared actual Head of the Charles performance versus the USRowing handicaps. And just in the past month, Tolly Allen used the C2 rankings data from 2014 to analyze the accuracy of the USRowing handicap system for head racing.
This analysis builds on this prior work by using a larger set of to look at different distance events and whether the handicap system is fair for different groups of rowers
- Male vs Female
- Open weight vs Light weight
- 50th, 75th and 90th percentile ranking level
Introduction
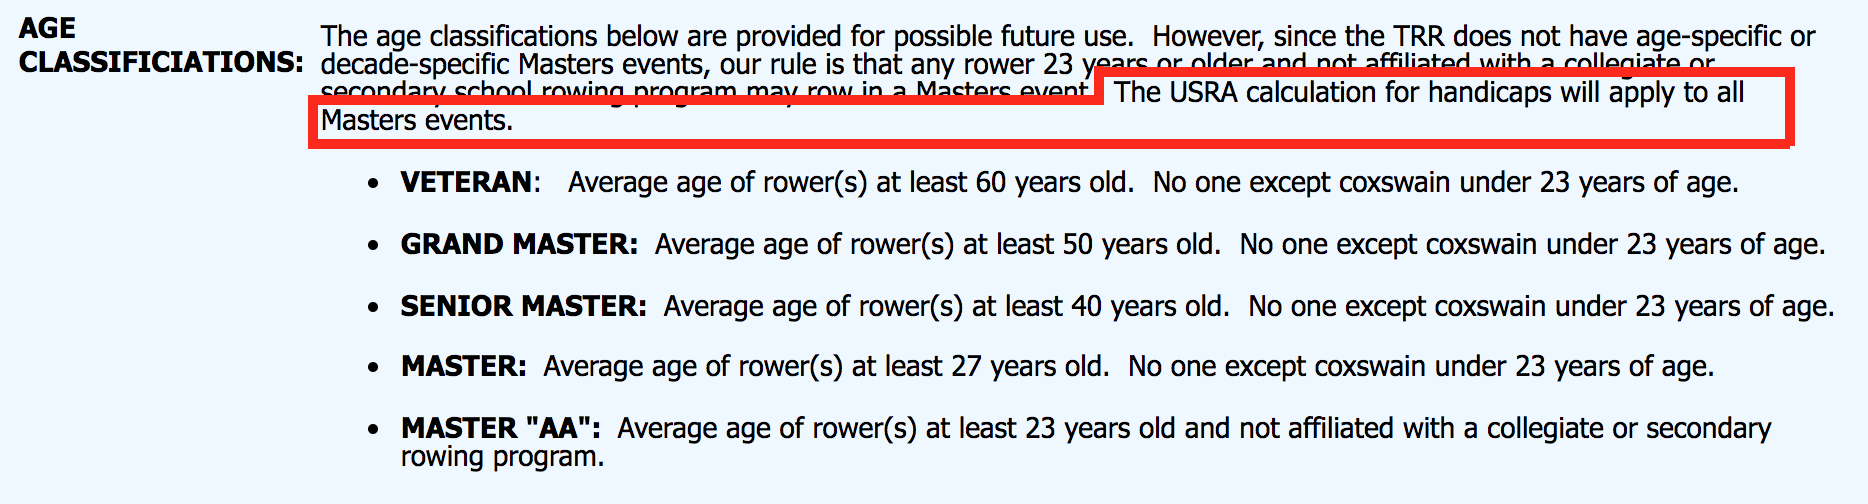
If you race as a Master in the United States, you find that some events use an age handicapping system developed by USRowing. For example, if you race in the Textile River Regatta (which I highly recommend because it’s a great race on an awesome river), you will see this in the rules.
And when you see your results, you see this.
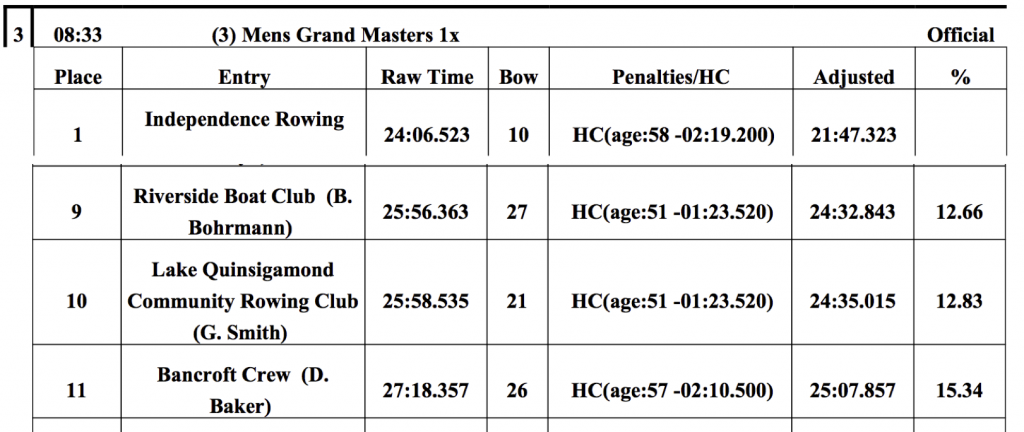
So, I rowed the course in 25:58.535, an embarrassing couple of minutes slower than the winner, but my “Adjusted” time was 24:35.015. This 1:23.52 adjustment is derived from a formula that you find with some creative googling here.
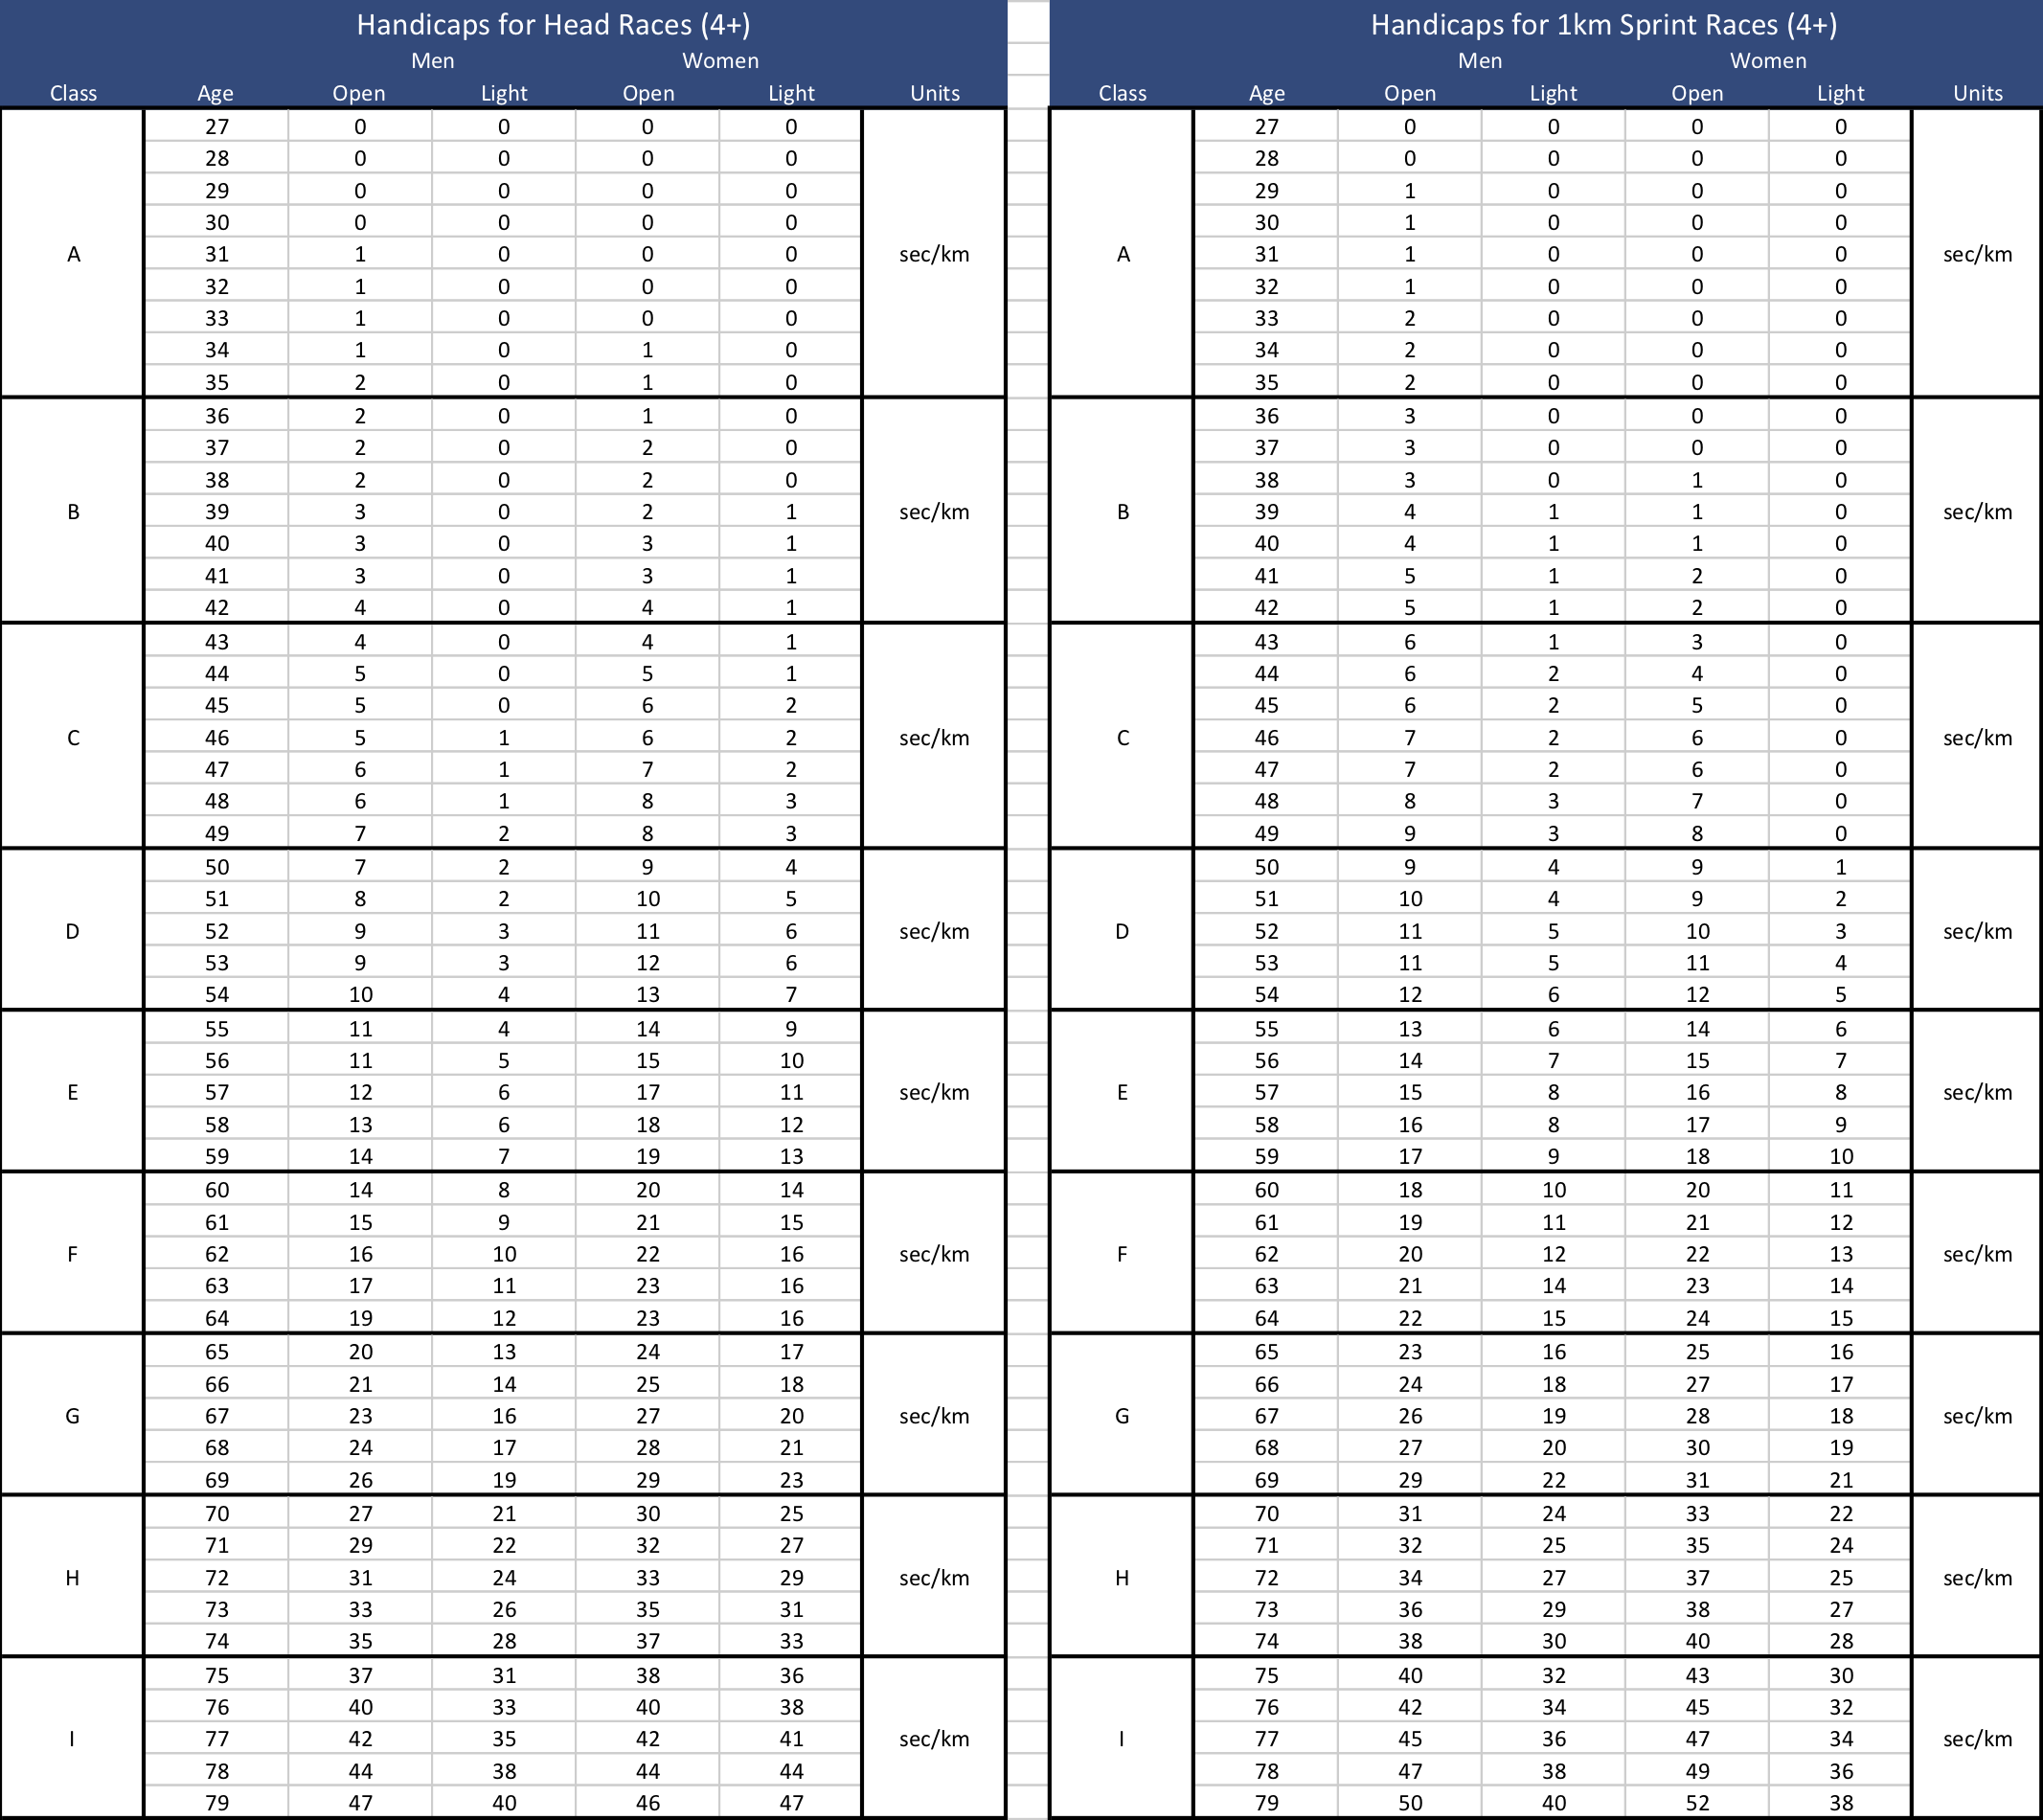
This is the chart provided by USRowing.

An important piece of information is missing. The formula and the table gives you a whole bunch of numbers, but what does these numbers actually mean? It turns out that this is the number of seconds of handicap per kilometer rowed. If I’m 55, and I row a kilometer in 4 minutes (240 seconds raw score), my handicap (19.6 seconds) would be deducted from my raw score to yield a corrected time of 220.4 seconds. The handicaps can be used differentially. If I am rowing head to head against a 50 year old, we can handicap our race by subtracting the values. If we are racing over 1km, you should give me a head start of 6.4 seconds (19.6 – 13.2).
This system has a nice simplicity to it, but every handicapping system will give advantages to some athletes and punish others. I was interested in figuring out how fair the handicap system was for different groups of rowers.
- Is the handicap system fair to apply to both men and women?
- Is it fair to compare lightweight and open weight rowers?
- Does it work better for average or higher performing rowers?
Also, given the different rates of decline in power that I saw for events of different durations, I wanted to see if the handicap system is fair for the two main masters event distances, 1km sprints and ~5km head races.
The Concept2 rankings provide a rich source of data for large number of rowers with important information about age, weight class and gender captured, but using erg based data to evaluate the handicapping system for on the water rowing has some complications.
First, pace is an artificial concept on an erg. The machine actually measures work, that’s why it’s called an ergometer. But, the good folks at Concept2 came up with a formula to provide an estimate of pace. From what I have read, the pace displayed on the performance monitor is calibrated to the pace that you would see in a 4+ if everyone was pulling the number of watts that the erg is measuring. This resulted in the formula…
- pace = ³√(2.80/watts)
The 2.8 is the empirically determined constant which would be different to emulate the pace of different boats. (and is user controllable on the RP3, from what I understand).
On the water, pace is everything. Equipment to measure power on the water is just starting to become available, and very few rowers use it. And frankly, racing is about going fast, so measuring pace is what matters. So, for this analysis, we will be using the pace values from the Concept2 rankings.
Since the concept2 paces are calibrated to 4+, we will first compare to the US Rowing handicaps for that class of boat, that means we will be using K=0.0216 as the constant in the handicap equation.
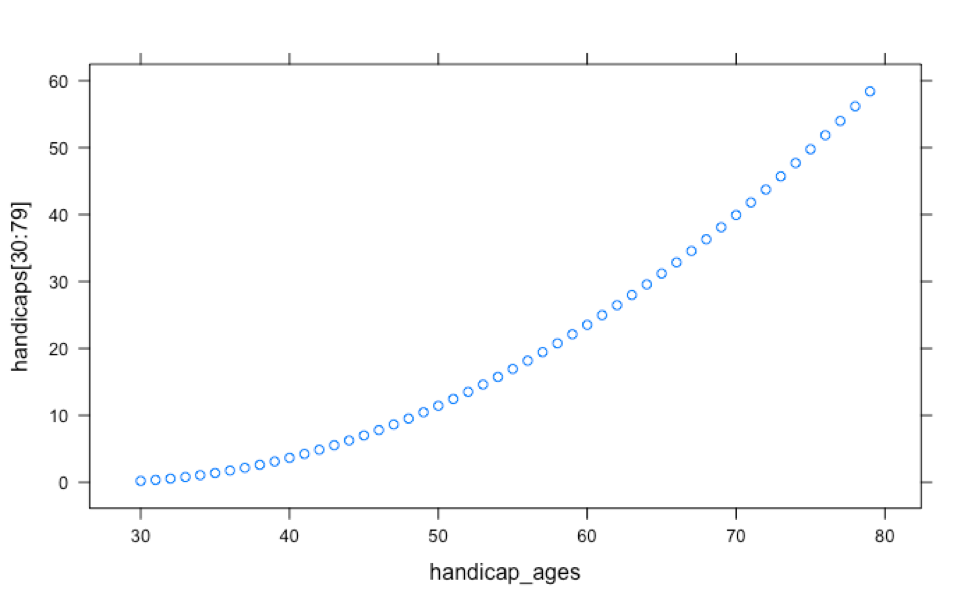
Here is the US Rowing 4+ handicap plotted as the number of seconds per km versus age.
To make things a little easier, let’s start by dividing the handicaps by two. This puts them into pace terms that all rowers can relate to, time per 500m. After 8 years of rowing, my brain is wired to think in those terms.
When plotted like this, you can see that a 60 year old gets about a 10 second pace handicap. If they row at a 2:00/500m pace, the corrected pace is 1:50/500m.

1km Sprint Handicapping
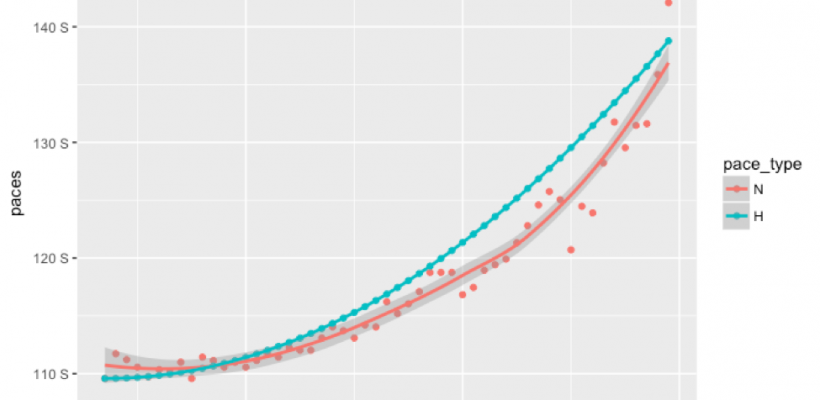
This analysis compares the ranked 1km results from the concept2 online logbook for all years from 2002 to 2018 to the US rowing handicap. The baseline for the comparison is the 1km performance at age 27, where the USRowing handicap is defined as zero. The analysis takes the 1km pace for a certain percentile value in the rankings at age 27, and then applies the handicap to it in order to predict what pace would be expected for older rowers. This generates a curve of predicted pace based on the handicap. The handicap pace curve is then plotted over the actual 1km pace at the same percentile ranking for each age in the concept2 data.
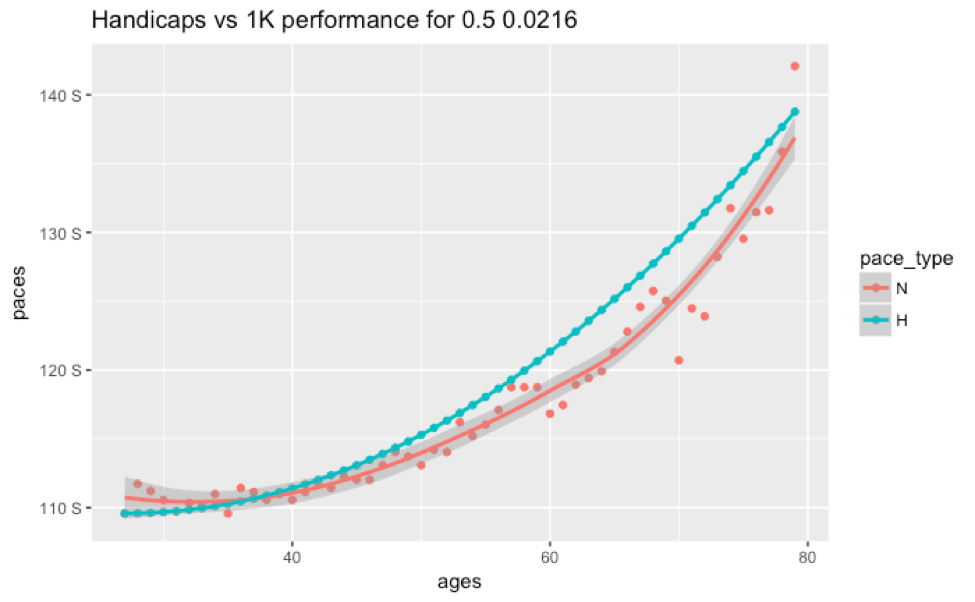
The green points are the predicted paces and the red points are the calculated 50th percentile paces for each age. The red line is a best fit curve to the data. This very clearly shows the same effects that Tolly Allen noted in his article. Specifically, that the there is no significant change in actual performance from 27 to 40, that the rate of decline is shallower than the handicaps predict up to age 60 and steeper thereafter.
Looking at the same plot for more competitive rowers shows that the effect is consistent, although there is a bit more decline prior to age 40.
Since we are most interested in the error in the handicap, we can plot the difference between the two curves. The error indicates that the handicap gives an increasing advantage to older rowers. A 50th percentile rower who is 65 years old will get almost 5 seconds more pace advantage from the handicap than concept2 rankings would support. This is a very good reason to maintain age groups in narrower ranges instead of applying the USRowing handicap across a broad set of ages. The data also show that the more competitive rowers have an even greater advantage from the handicaps as applied in this distance.
Handicap fairness for different groups of rowers
In part 1 of this series, I looked at the demographics of the concept2 rankings. By far the largest group of rowers is Open Weight men. Therefore, these curves are dominated by that group. If we want to see how the handicap rewards or punishes different rowers, we need to look at them by subgroup. First, we can repeat the analysis separately for men and women rowers. Although there is a significant difference in raw performance between men and women, the characteristic change with age is quite similar. The errors curves have different shapes, but the same increase in advantage with age is seen for both genders.
And the errors
Lightweight versus Open Weight
In Part 2 of this, it was clear that the characteristic decline in power was significantly different for lightweight rowers than it was for open weight rowers. Trying to translate that into On-The-Water performance adds a new complication.
On the erg, the pace that you achieve is directly related to the power by the formula shown above. In the boat, boat speed is strongly influenced by power, but it also is effected by rower weight. The heavier a rower is, the more water the boat displaces. As the boat displaces more water, it requires a greater amount of power to achieve the same boat speed. The delta between the performance of lightweight and heavyweight rowers is greater on the erg than on the water.
For example, the 90th percentile ranking for 19-29 male open weight 2000m is 6:12.5. The 90th percentile ranking for 19-29 male lightweight rowers is 6:25.0. The pace delta is 3.25%. For comparison, Kleshnev analyzed the results of the world championships and found an average delta between lightweight and open weight of ~1.7%. The difference between these values, 1.55%, is worth about 4 seconds over 1km.
So, in order to use concept2 erg based data in an evaluation of the US rowing handicaps, the erg based data should be weight adjusted. Since the effect of weight on speed is not correlated with age, it will be a constant offset. In essence, it is irrelevant if lightweight and open weight rowers are in different events, but if lightweight rowers and open weight rowers are in the same event, the handicap “error” must take this effect into account.
When you split the data into lightweight and open weight classes, you can see that the handicap curves fit much better for open weight rowers than for lightweight rowers. The increasing advantage with age seems to be restricted to the lightweight class of rowers. This is due to the phenomenon that was found in part 2 of this series. Essentially, lightweight rowers age better than open weight rowers. In terms of raw performance, open weight rowers are faster than lightweights up to the age of 50. After that lightweights are actually faster. This is not really an issue with the handicap system, but rather would argue for maintaining separate lightweight and openweight events for masters regattas.
The errors again are consistent for more competitive rowers as well.
Handicaps for Head racing
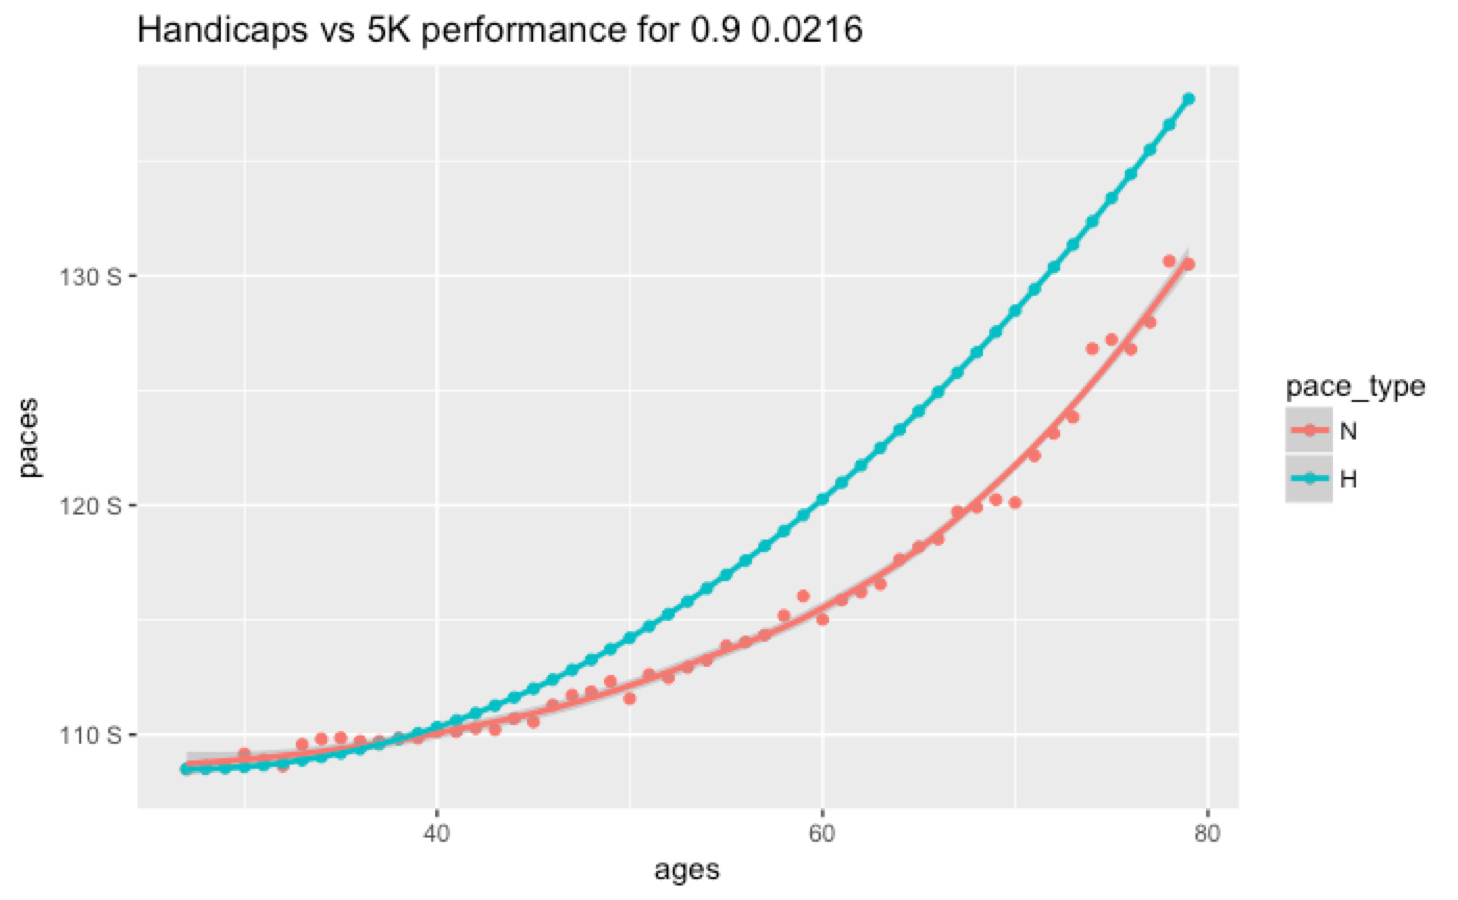
So we’ve seen that the US rowing handicap system provides about a 5 second pace advantage for older rowers in the 1km event when compared to the actual decline in erg results. In part 3 of this series, we’ve also seen that the performance of older rowers declines a bit more steeply in shorter events than in longer events. What does that mean when the US Rowing handicap is applied to head races? For that I’ve used the 5km ranking distance as a proxy. (As Tolly Allen did in his article). The following chart essentially replicates his findings. He used the 10 best results in each age group for one year. I am using the 90th percentile level in the rankings across all years from 2002 to 2018.
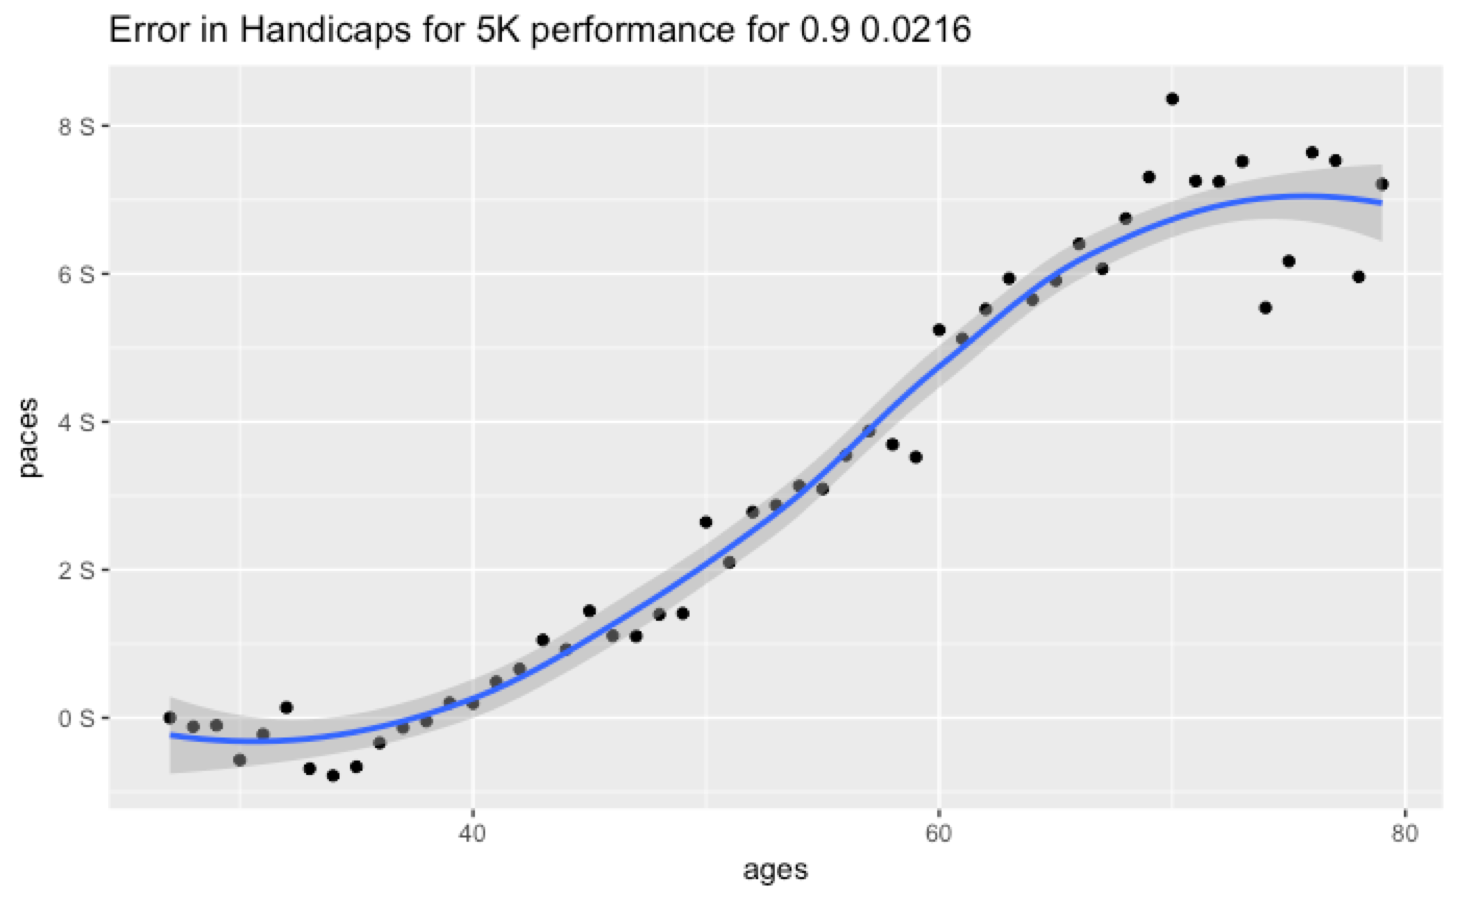
There is no significant decline up to age forty, and then an increasing decline thereafter. Examining the error plot, the advantage provided by the UR Rowing handicap for older rowers is greater at the head race distance. For the 1k distance, the best fit line peaked at about a 5 second pace advantage. For the 5k distance, the pace advantage is closer to 7 seconds for rowers over 70.
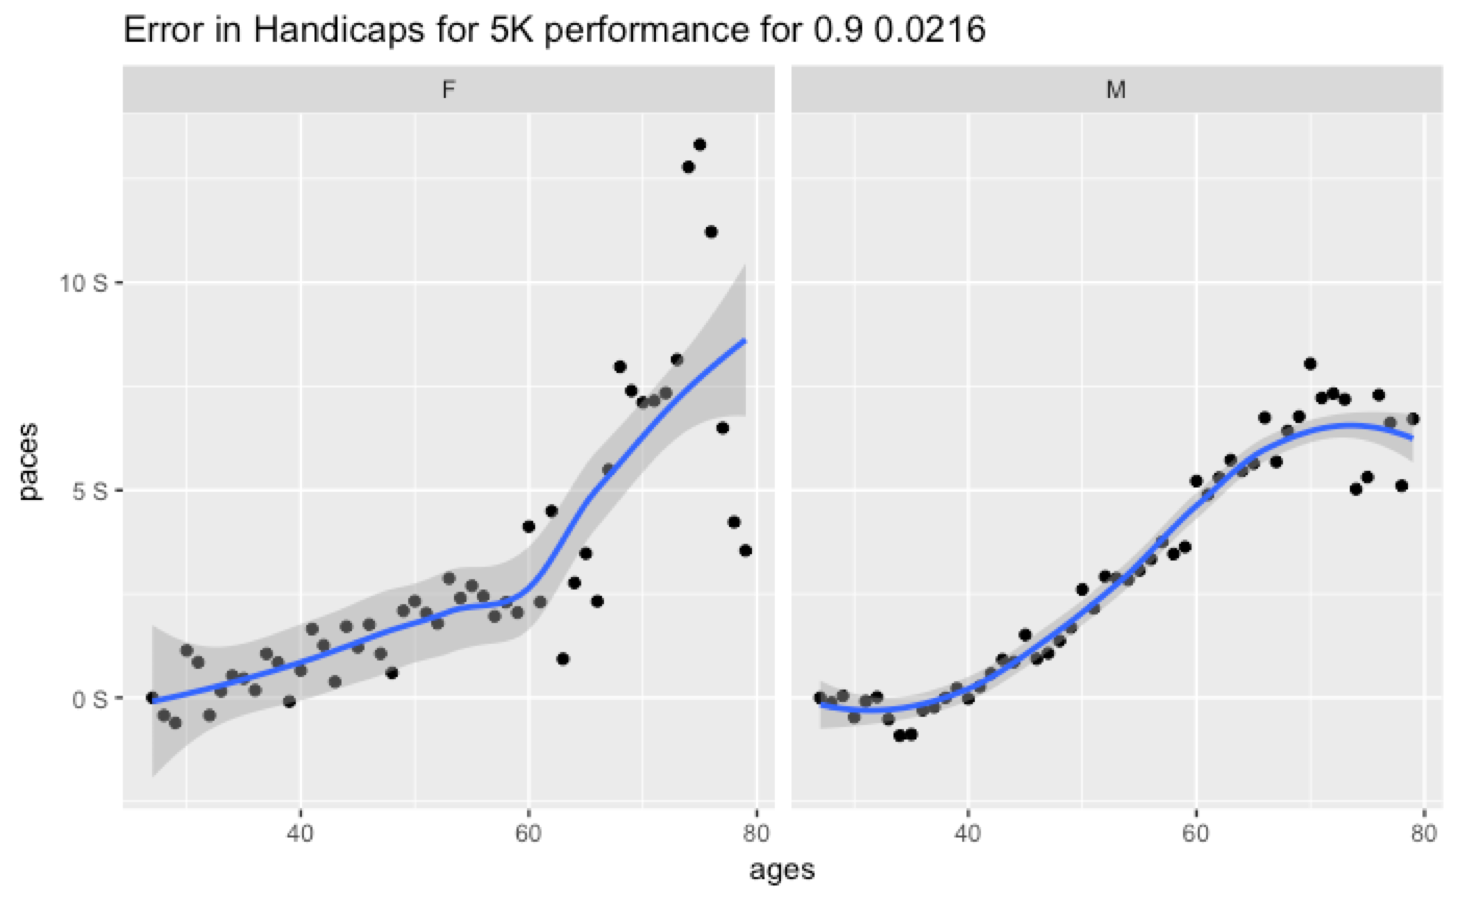
Looking at the data by gender shows the same characteristic as the 1km distance, with a slightly larger advantage for women rowers from the handicap.
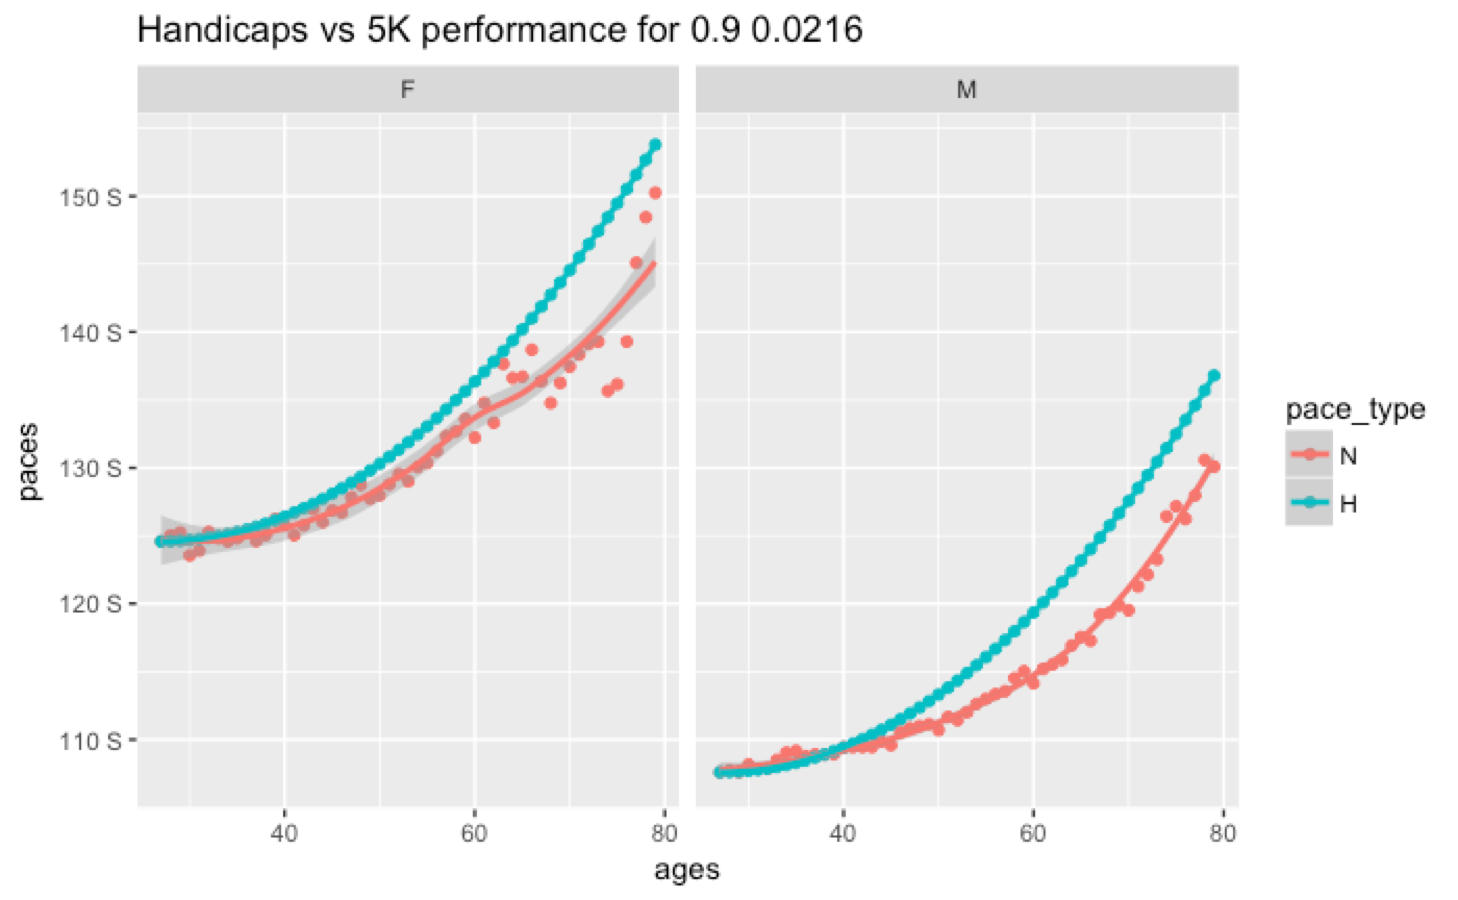
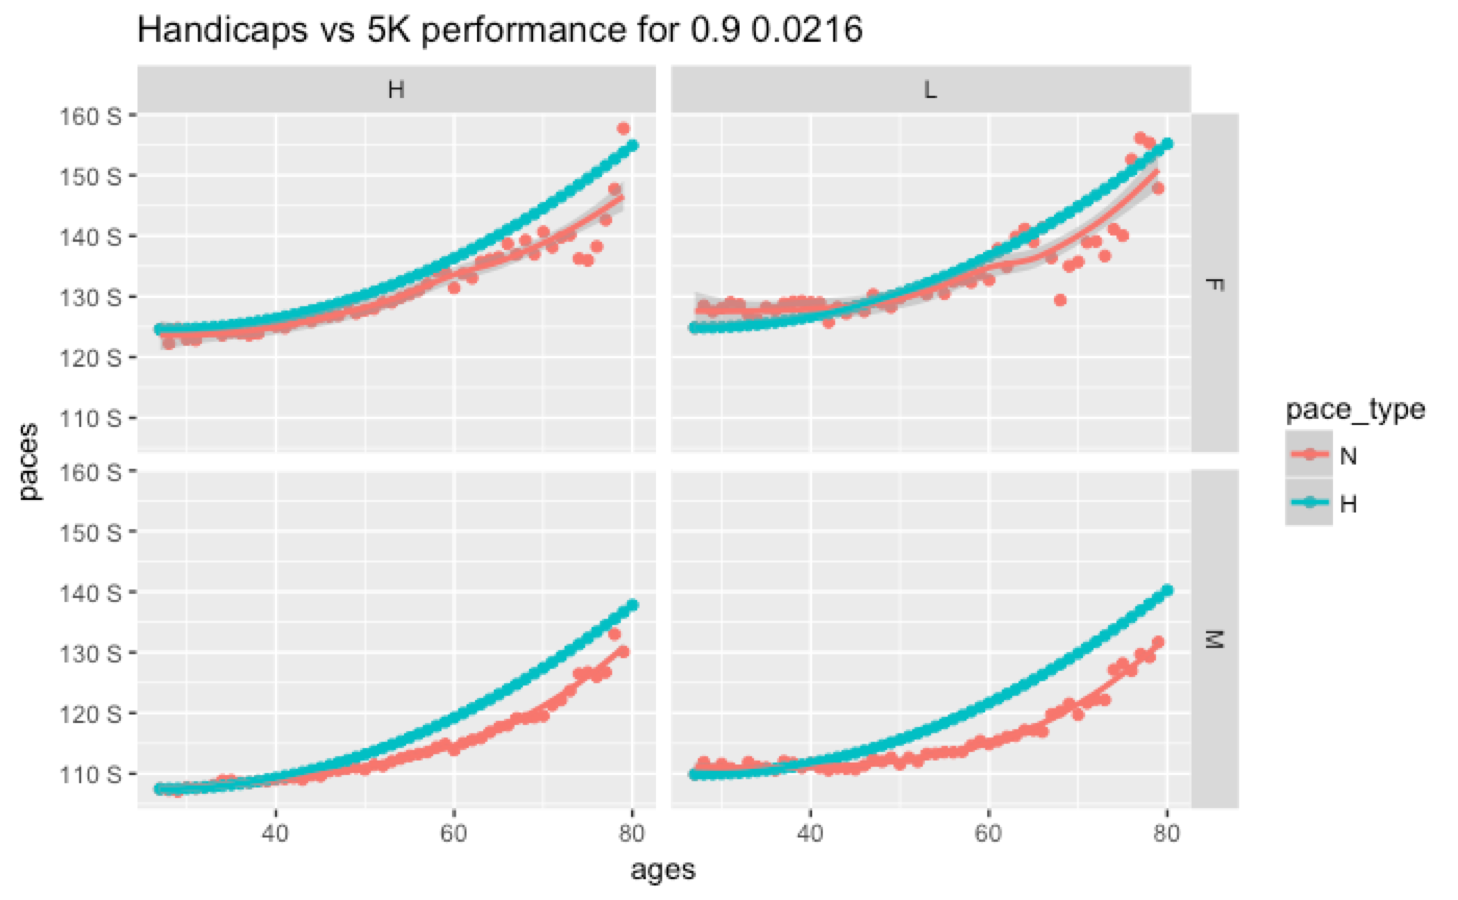
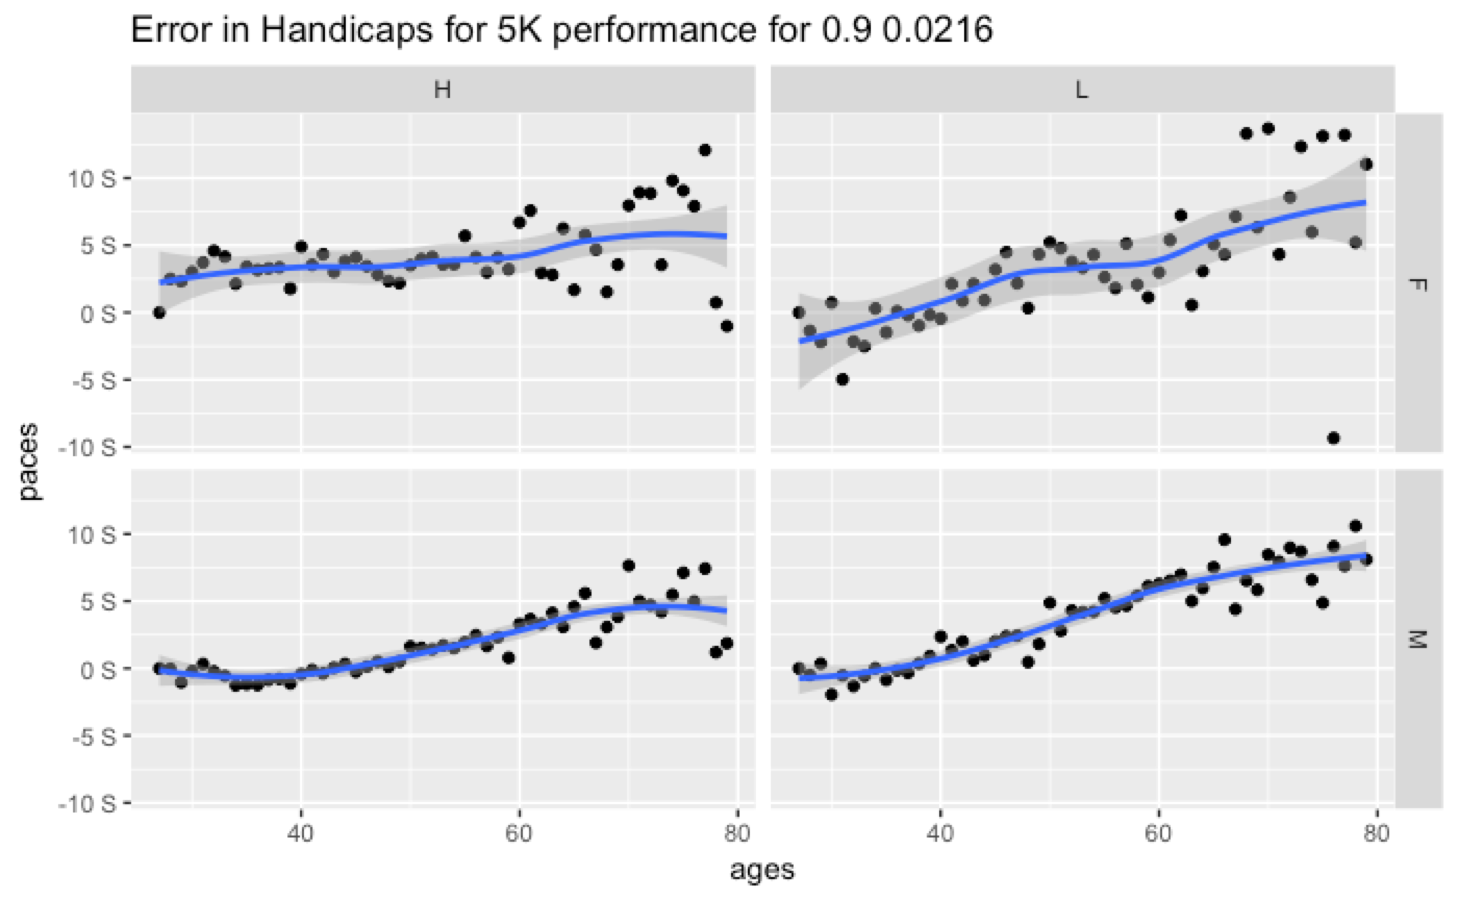
Dividing into weight classes shows the same general characteristic, but here we see that even open weight men now are provided an increasing advantage with age.
How much of an advantage is 7 seconds on pace? Our predicted baseline pace for a 90th percentile men’s open weight 4+ is 105 sec per 500m (1:45 pace). The USrowing handicap would predict that the pace for a 4+ with 60 year old rowers would be 2:00/500m, but based on concept2 ranking data, that 90th percentile boat would be more likely to row at a 1:55 pace. Over a 5K race that’s a 50 second difference.
Recommendations
The whole topic of handicapping rowing events is one that is sure to provoke spirited conversations among groups of masters rowers. As soon as you start to qualify the results of a race, with some sort of a “system”, you begin to lose the essence of racing, which is the thrill of rowing faster than someone else across a fair course.
I have to admit that I am not a fan of handicapping. I much prefer the idea of running separate events for rowers of different ages, weight classes and ages. But this is not very practical for smaller events and ends up with lots of races that have no real competition. In general, it is probably simpler to broaden the groups, without a handicap and just accept the fact that younger, open weight rowers have a natural advantage. But a handicap system can give a broader group of rowers an opportunity to be competitive by making fair adjustments to raw results.
In my opinion, the existing US Rowing handicap system is not a fair adjustment of results. Across relatively narrow age groups, say a 20 year block, it’s probably not going to effect results much, but in that case, it’s probably even better to just row with the handicap at all. If the handicap system is going to be used for an event where men’s master’s rowers of all ages from 27 to 80 are rowing against each other, then it provides a significant advantage for older rowers, and lightweight rowers.
In my opinion, it is possible to use the concept2 ranking data to establish a fairer handicap system. What should such a system look like?
- It should have a unique set of handicaps for sprint and head race distances, since there is a significant difference in the age related decline between the two.
- It should have unique tables for gender and weight class to match the results of these groups.
- It should be based around the 90th percentile ranking level in the concept2 rankings. This provides a sufficient population of rowers in each age and grouping to avoid significant distortion from individual performance. Essentially, this will allow the best rowers to outperform the handicaps.
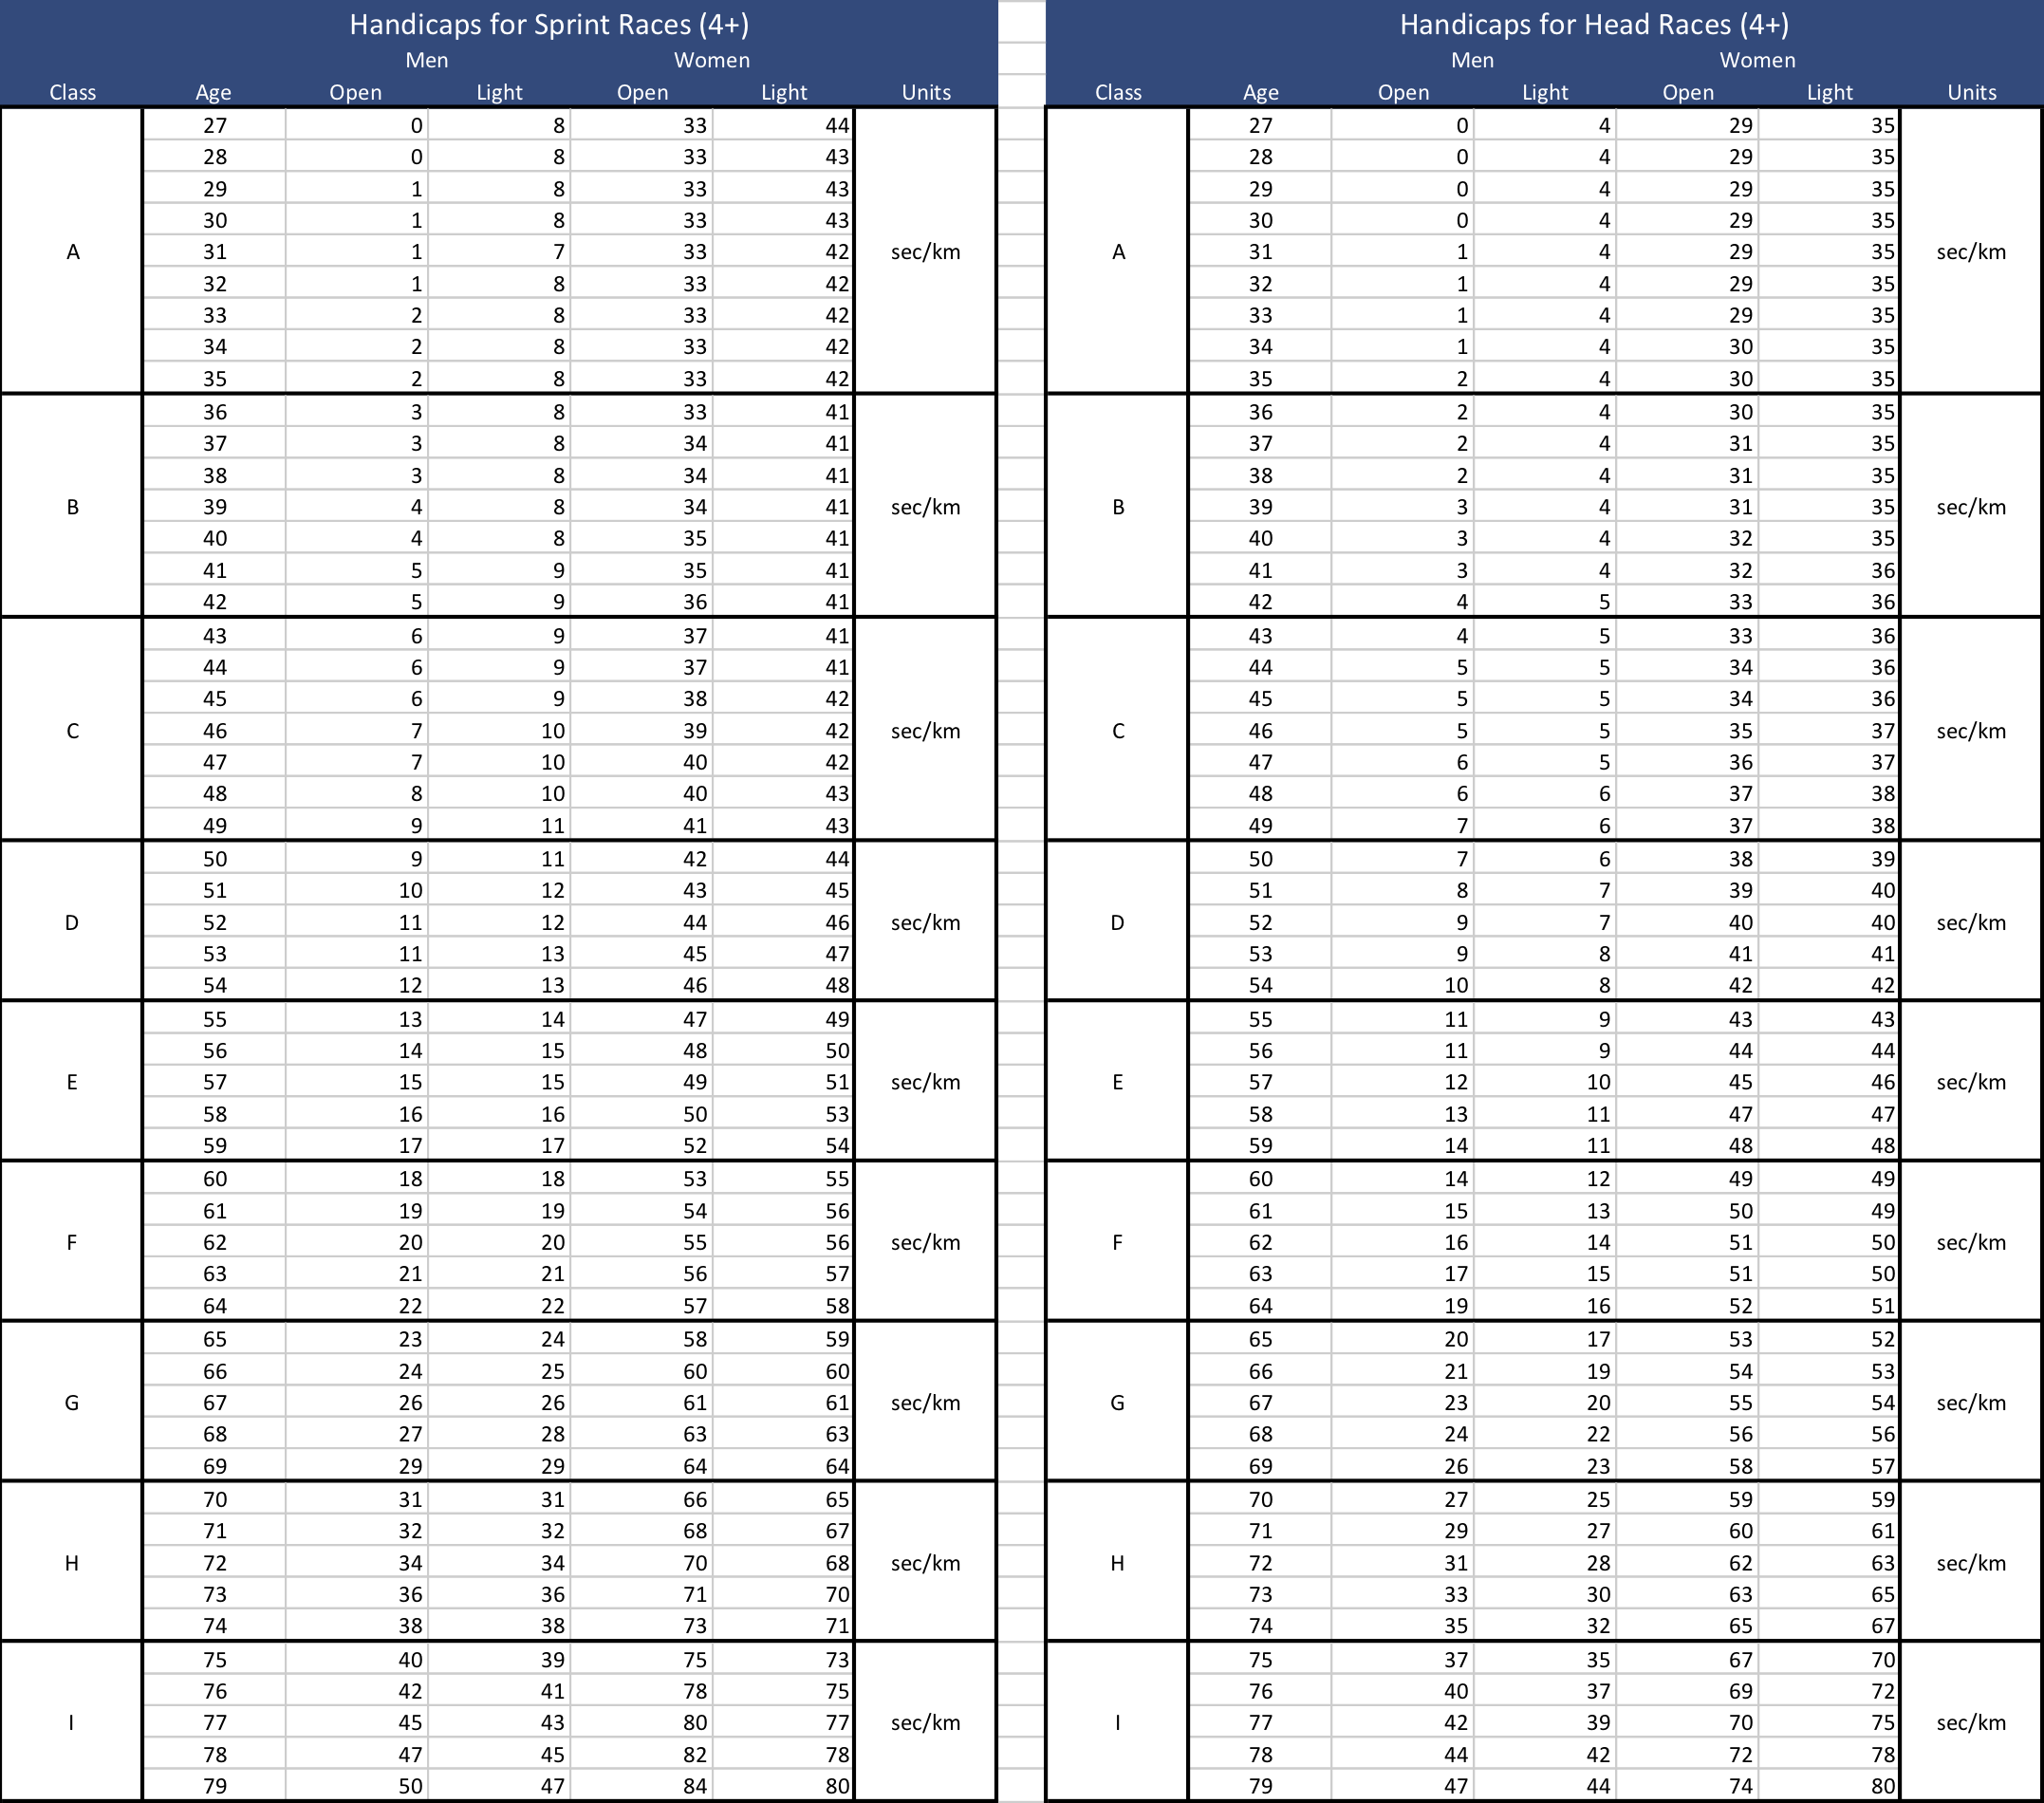
New Handicaps
I computed the handicaps two ways. The first is within each class of rowers. This would be used for events where lightweight and heavyweight rowers are segregated in different events. It uses performance at 27 years as the baseline and provides a seconds per km adjustment for increasing age.
The second table is a unified system, where an absolute correction is applied to all rowers. This would allow rowers of different weights and both genders to compete in a single event, for example if a club wanted to run a scrimmage that included all rowers.
segregated handicaps
unified handicaps
Conclusions
This analysis has provided a comparison of concept2 ranking data to the US Rowing age handicapping system. It has shown that the handicapping curves are not well correlated the actual decline in performance as shown in the C2 data. The US Rowing handicaps appear to be significantly skewed to the advantage of older and lighter rowers.
While no system is perfect, I think it would be possible to significantly improve the fairness of the handicap system by leveraging the body of data about indoor rowing performance.
In the next part of this series, I will be looking at individual power curves. So far, I have been using the population statistics for each event in isolation. In part 6, I will link results across events to see how well the best rowers match up to the best scores at all distances. I will also examine whether the critical power curve changes as rowers age.
About me:
I’m a 55 year old, open weight masters rower. I compete in OTW sprint and head races in the Boston area, primarily in the 1x and 2x. I also do some recreation coastal rowing on Cape Cod.
I maintain an online training journal here: https://quantifiedrowing.wordpress.com/