Background Information
Last Sunday I raced a 1000m race in Piestany, Slovakia. At my home lake, I had prepared with the power meter and obtained an average power value that I could sustain over 4 minutes (1000m) of about 320W. The race circumstances differed in a few aspects. Where I tested on a lake with standing water and neutral conditions, the race was held on a river with high water and a “fast” current, and in tailwind conditions. Complicating factors were the river current which even caused whirls in some parts, and wake from referee launches. A big distraction was of course the fact that this was a race against real opponents, with their own race tactic. The experiment was to see how the power meter can help executing a winning strategy on such a short distance.
In this post, I will try to analyze the outcome of the experiment. First, I will describe the race execution, after which I will jump to the conclusion. The last part of the post describes detailed stroke by stroke analysis, which give more insight in how the race was executed, but doesn’t impact the main conclusions.
Race Execution
A few minutes before I wanted to launch, I was fiddling with my SpeedCoach and the single, when it started to rain. I turned around the single in the slings and reached our tent just in time before it started to rain really hard. I saw some of my competitors rowing to the start in the heavy rain. I checked the sky and decided to wait until the rain had completely stopped. It shortened the time before the start a bit, but there was still some reserve, and I figured it was better to arrive at the start line dry and not with a boat filled with water.
For me, the race was an experiment. With the power meter in the boat, I was torn between just rowing my usual race and trying to adhere to a certain power number and trying to flat pace. I guess the end result was a hybrid, but it was interesting.
The “ideal” pace was to row somewhere between 320W and 340W average on the SpeedCoach, 32spm, and try to ignore the other rowers. I estimated that 320W was a bit on the low side, given that the race was going to be shorter than my 4 minute trial run.
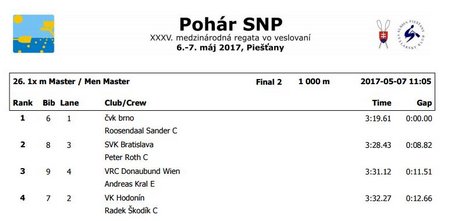
I was second out of the start, with the guy from Bratislava a length ahead.
It is very hard for rowers to ignore other rowers in such a race situation. There is nothing better than being the first out of the start and to look at the competitors.
Still, I decided to go to slightly above sustainable pace (350W) but not much higher. So I ended up rowing about 400m behind this Bratislava guy, and then I finally started to move. Looking at the pace values in hindsight, I didn’t really speed up, but he was slowing down. During the race, I could also see that from the Power value, and I must say it was quite a nice feeling to hold 320W and see that I gained on him with every stroke. The passing took about 15 to 20 strokes and it felt effortless, blissfull, Wu Wei and all that.
Then I was ahead of him and I decided to continue at 32-33spm and trying to hold 320W. I noticed my power dropping and tried to increase it a bit. It was nice to row 33spm in front of the public.

Conclusion
In the short time of the race, I did not take a single look at effective drive length and wash, the two other metrics I had decided to see on the SpeedCoach display. With the race tactics unfolding, I managed to look at (and process) the power value and SPM. I think the biggest benefit came from having an idea of a sustainable power, obtained from the trial run. It definitely helped me rowing a more “flat” pace than in my usual OTW racing endeavours. Yes, I did row hard to catch up with the leading opponent, but I constrained the power and managed to keep my head cool. I guess the race was just long enough to enable that. In a 500m sprint, you are too close to the finish line to use a “wait and see” tactics.
You could say that I was lucky that the other guy ran out of steam, but I would respond that the argument should be the other way round. I didn’t run out of steam as much as he did, because I knew how hard I should pull in the first half of the race, while he got carried away trying to keep his lead.
I think trying to flat pace as much as possible is a good strategy in any race of a longer duration than 2 minutes, and I am convinced that the power meter helped me do that.
Stroke Analysis
In this post I am looking at a few detailed metrics of the Masters 1x 1000m race I rowed yesterday. Data were collected with a SpeedCoach GPS 2 combined with a NK Empower Oarlock.
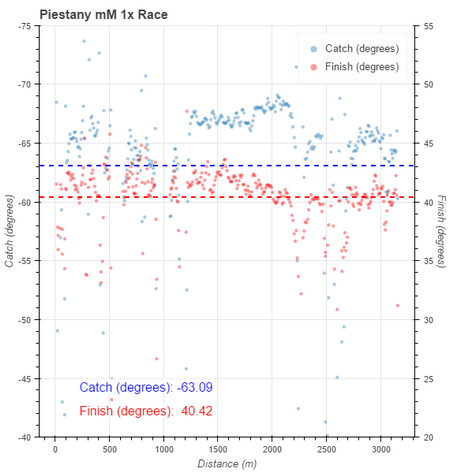
Here is the overview plot of catch and finish angles for the entire outing, including warming up and cooling down. The actual race starts at 1200m. Interesting to see that I seem to suddenly take length about 400m before the finish line. This is exactly the point where I finally passed my opponent and actually started to row at a lower power.
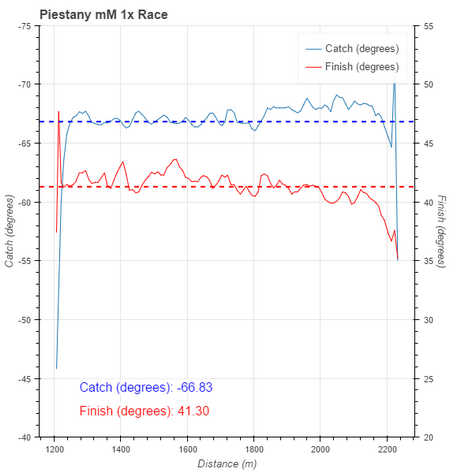
Here is a close-up of catch and finish angle for the race segment. We’re talking a 1 degree difference, but still it looks pretty consistent and significant.
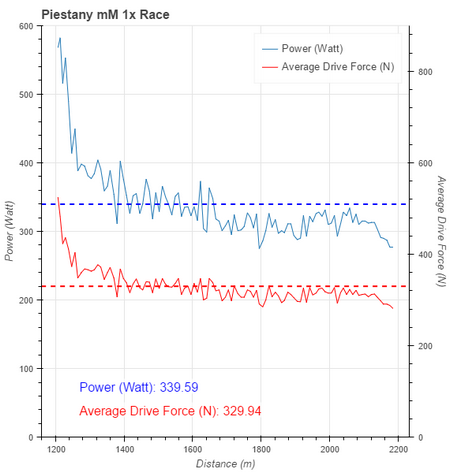
So here is the power and average drive force. The start strokes are always at high power and force, as you are starting from a stop and rowing short strokes at high rate. I think I did a pretty good job getting the average force down to an average value and holding that for the rest of the race. It is interesting to see the power drop about half way, while the drive force remains constant, and the catch angle actually increases. That means that I either started to row at a lower stroke rate, or the actual stroke was shorter despite the catch angle being longer.
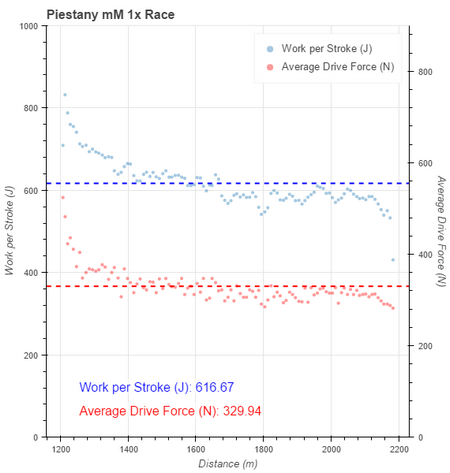
The plot thickens when we look at the “Work per Stroke” which drops with the drop in power. So it looks like the stroke rate remained constant, but something else was changing.
Funny enough, both the absolute drive length and the effective drive length remain constant for the entire race and at pretty good values. So the shift in catch angle was actually me focusing on length (after I had passed my opponent) and tap-down (which makes the stroke slightly shorter at the finish). Should be visible from Wash values.

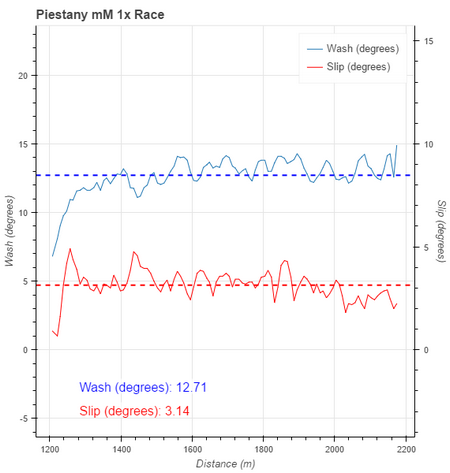
Looking at Wash and Slip values, I cannot see a big difference:
Finally, the solution to the riddle seems to be the Peak Drive Force:
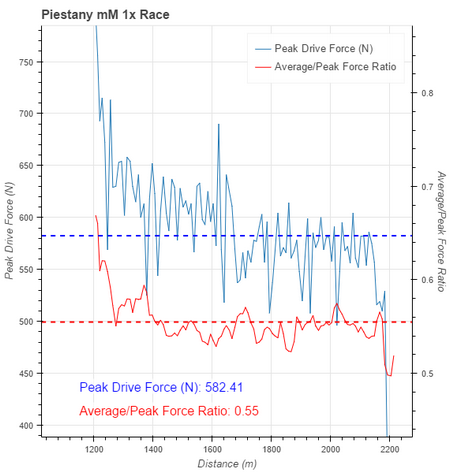
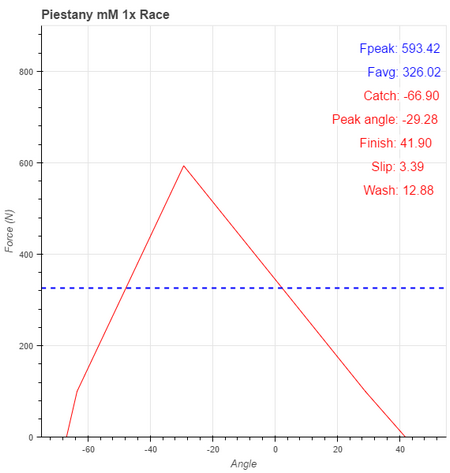
Interesting! I hadn’t expected that. The stroke profile plot for the first half of the race:
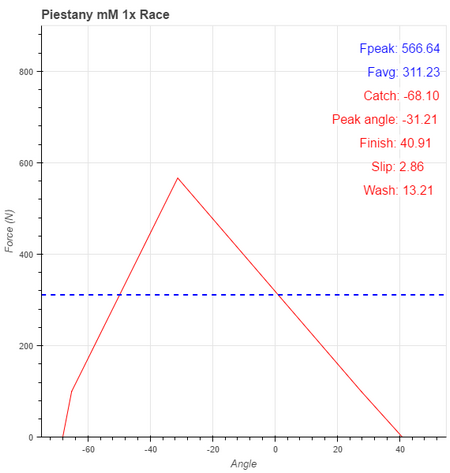
And here is the second half of the race. Almost identical to the first half, but the tiny difference do lead to a drop in power, while my pace didn’t drop as much as that of my opponent.
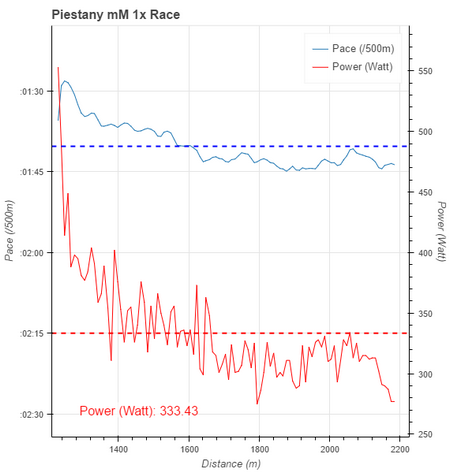
Here are power and pace in one plot:
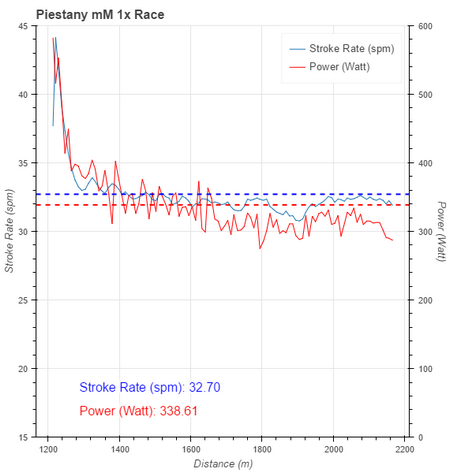
And finally, stroke rate and power: