
This is the second part of a series. The first part is Aging and Rowing Performance – Part 1: Introduction and Methodology.
To examine the effect of aging on rowing performance, let’s start with the 2K event. This is the event with the highest participation, and the one that has the most competitive opportunities for indoor rowers. In general we know that rowers slow down when they age.
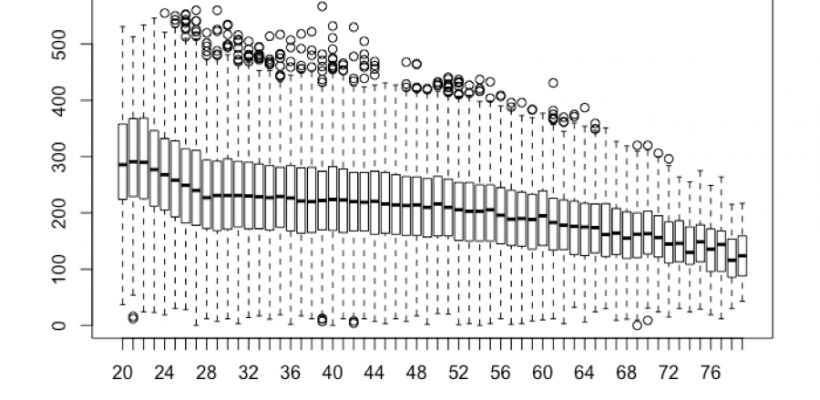
We can easily see the trend in this boxplot.
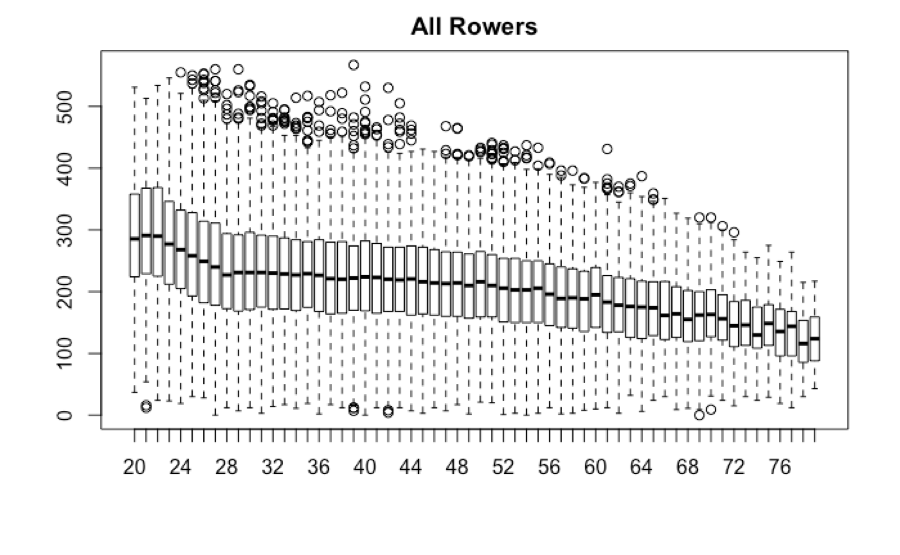
If you fit a line to the data, you see that the decline is 2.19W per year. But it is clear that the trend is far from linear throughout.
The first noticeable trend is a tremendous decline through the 20s. This does not line up with common sense. Most elite level rowers are in their late twenties or early thirties. It is possible that participation in the rankings is not consistent in this cohort. I am open to other theories here. Most elites do not rank scores, maybe other club level athletes do not either. Or perhaps they are too busy with careers and babies to do as much rowing.
In any case, since we are interested performance for Masters rowers, it makes sense to restrict the analysis to ages 30 to 79.
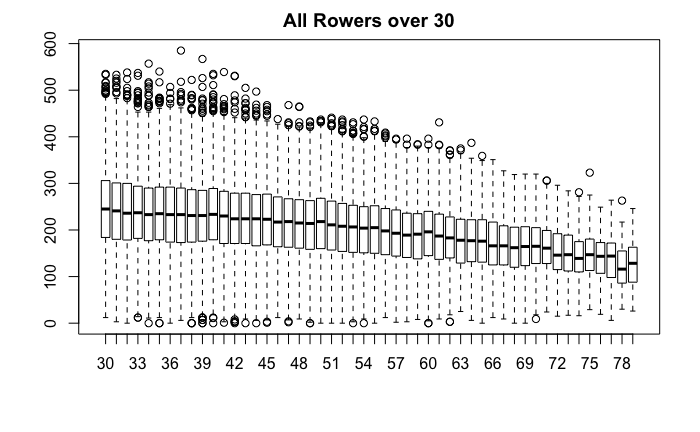
If you fit a line to the mean of each years results, the decline is 2.13W per year, about 0.87% per year. But the decline is not very linear. It is much slower from 30 to 40 than after that.
Is the decline the same for men and women?
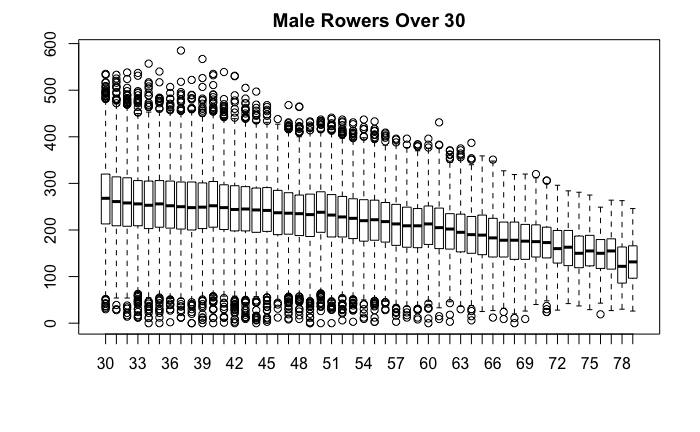
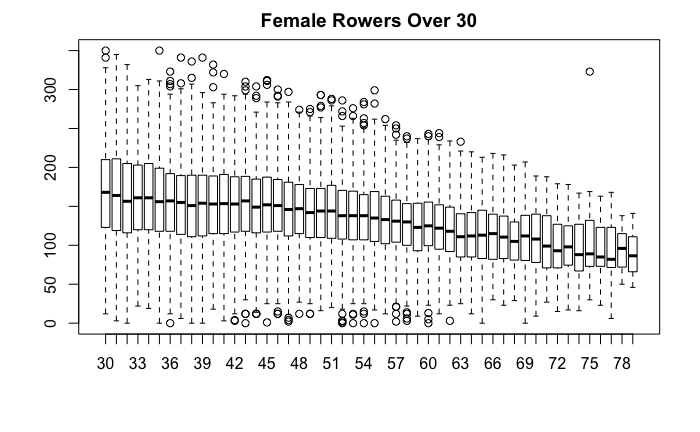
The chart for male rowers looks a lot like the one for all rowers because there are about 4 times as many male as female rowers. The curve for women is different, actually improving through the early forties and early sixties.
We can also look at the difference between Open Weight and Light Weight rowers.
Open weight rowers have a more linear decline after the age of thirty. Lightweight rowers of both sexes have quite stable performance, and decline after 40.
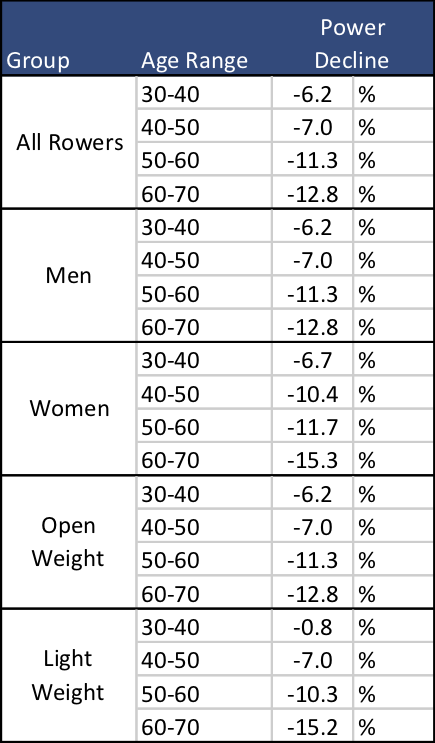
It’s a bit easier to compare the decline in tabular form. From this, it is clear that the one group with a significant difference from others is lightweight vs heavy weight.
Although these charts show the full distribution in each age, it’s difficult to see if the decline in power is consistent for rowers that are higher in the ranking. I looked at this and compared the decline for “average” rowers, in the 50th percentile of the rankings, for 75th percentile rowers and for 90th percentile rowers. The following table shows the decline over each decade for these different groups.
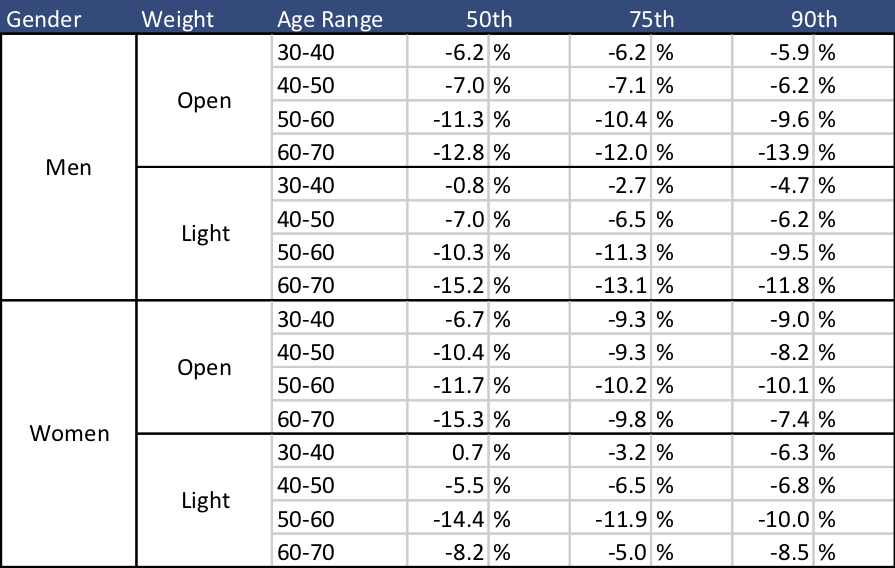
In most cases the 90th percentile rowers decline less than the average rowers. But interestingly, the very best lightweight rowers do experience a decline in the 30s that is not seen for the average rowers.
In the next part, I’ll take a look at the effect of aging for different duration events.